OR&R’s Disaster Preparedness Program hosted a three-part virtual Hurricane Preparedness Summit in preparation for the 2020 hurricane season. The Summit focused on the National Ocean Service’s (NOS) hurricane readiness in the midst of the COVID-19 pandemic. Each NOS program office discussed how they implemented lessons learned from the 2020 hurricane season; identified challenges and limitations that NOS faced for deployments, missions, personnel, and resources during the 2020 hurricane season; and developed guidelines and policies to ensure NOS personnel can safely respond to a hurricane. The three-part summit also included contributions from important NOS federal and state partners, including the National Weather Service, Federal Emergency Management Agency, U.S. Coast Guard, U.S. Environmental Protection Agency, General Services Administration, and the Centers for Disease Control and Prevention.
Providing Incident Coordination Throughout the 2020 Hurricane Season
OR&R’s Disaster Preparedness Program (DPP) supported NOS preparedness and response operations for each of the tropical storms and hurricanes that threatened and impacted the coastal U.S. during the 2020 Hurricane Season. As the incident coordinators, DPP staff were responsible for coordinating across NOS program offices when multiple offices were impacted by an event. The DPP gathered information on mission readiness, logistical needs, and impacts to personnel and infrastructure before, during, and after each storm.
The DPP also coordinated information on the tracking and safety of all NOS personnel in each storm’s area of impact, as well as the closure, impacts, and reopening of numerous sanctuaries, estuarine research reserves, facilities, and laboratories. The program coordinated the operational mission support provided by multiple NOS program offices to federal, state, and local partners; and provided use of NOAA’s Gulf of Mexico Disaster Response Center for mission critical activities.
Center for Operational Oceanographic Products and Services (CO-OPS)
CO-OPS Communicates Real-Time Water Level Information
CO-OPS issued 142 Storm QuickLook postings for 14 tropical cyclones during Fiscal Year 2020. Storm QuickLook provides a synopsis of near real-time oceanographic and meteorological observations at locations affected by a storm and are updated three times a day. For the third year, CO-OPS communicated real-time water level information from Storm QuickLook through NOS social media during storm events.
CO-OPS products detected record-breaking or near record-breaking flooding during several storms this year throughout the Gulf of Mexico. During Hurricane Hanna, water levels at Bob Hall Pier in Corpus Christi, Texas, reached 5.42 feet above Mean Higher High Water, eclipsing the previous measured record of 4.29 feet caused by Hurricane Ike (2008).
Many other water level stations, which were installed over the past decade, detected new records during this extremely active Atlantic hurricane season. The CO-OPS field team in the Gulf of Mexico experienced significant impacts, interweaving hurricane preparedness and response with pandemic limitations to travel and maintenance activities.
National Geodetic Survey (NGS)
NGS Collects Damage Assessment Imagery after Hurricane Isaias
NGS collected aerial damage assessment images of areas affected by Tropical Storm Isaias. NGS crews flew over areas identified by NOAA in coordination with the Federal Emergency Management Agency, the U.S. Coast Guard, and other state and federal partners to collect the damage assessment images. Aerial imagery is a crucial tool used to determine the extent of the damage inflicted by flooding and to assess damage to major ports and waterways, coastlines, critical infrastructure, and coastal communities. This imagery provides a cost-effective way to better understand the damage sustained to both property and the environment.
The NGS flight crew flew over more than 2,700 square kilometers during 16.4 hours and collected 8,933 images. NOAA’s aerial imagery aids safe navigation and records storm damage to coastal areas.
NGS Collects Damage Assessment Imagery after Hurricane Delta
NGS collected aerial damage assessment images in the aftermath of Hurricane Delta. NGS flight crews collected images in specific areas identified by NOAA in coordination with the Federal Emergency Management Agency and other state and federal partners. The crew flew more than 5,212 square kilometers during 12 hours and collected 9,741 images.
Office for Coastal Management (OCM)
OCM Provides Support During 2020 Hurricane Season
OCM assisted numerous state research reserves and coastal zone management programs to help the programs and their constituents prepare for and respond to the 2020 hurricanes. Efforts included a pre-season, peer-to-peer webinar held for Gulf, Southeast, and Caribbean partners to discuss the unique needs before the programs in regards to hurricane preparedness and recovery during a pandemic. Other efforts included supplemental funds provided to fund repairs to boardwalks and a water quality monitoring station, and to address needed satellite communication upgrades. Through the online Digital Coast platform, OCM provided data and resources that aid recovery efforts, including lidar, elevation, and land cover data; risk and vulnerability assessment methods; and coastal flood inundation and impacts maps.
U.S. Integrated Ocean Observing System (IOOS®)
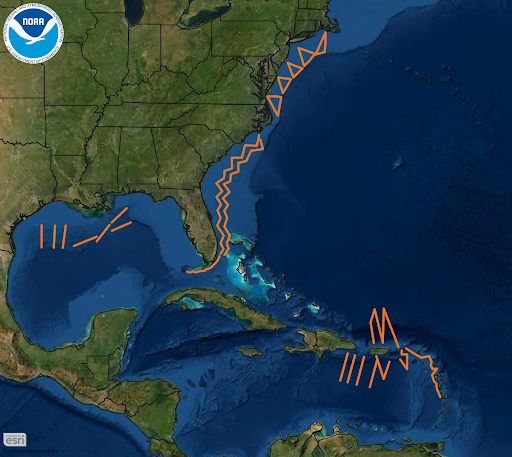
Hurricane Gliders Increase Observations in FY 2020
Orange lines show the planned paths for the gliders where they would gather temperature and salinity data from the surface to a half mile below. Once launched, gliders make regular dives along a set course and surface several times a day to send collected data to an available satellite, transmitting it to the U.S. IOOS glider data assembly center, and from there made available to forecast models as well as the public.
The hurricane glider project set a new record for glider days (1,801), deployments (45), and data gathered during the 2020 hurricane season. Augmented by 18 “gliders of opportunity” — gliders deployed by partners on unrelated missions who share temperature and salinity data with the hurricane project — 2020’s total is 2,569 glider days and 137,272 gathered observations.
This year three hurricanes — Isaias, Laura, and Sally — passed within range of the gliders, capturing invaluable ocean data below the storms, while hurricane hunter planes captured atmospheric data above.
NOAA, the U.S. Navy, and over 20 federal, state, research, and private sector partners work together to build our nation's capacity for hurricane prediction and forecasting. Ongoing, coordinated glider missions in areas of the ocean known for rapid changes in hurricane intensity, like the Gulf Stream or the Mid-Atlantic cold pool, gather critical data to improve forecast models and help us understand the relationship between ocean conditions and storm development. And the benefits are apparent: as this data continues to come in, models are increasingly showing more accurate subsurface conditions. A comparison between forecast models and real-time observations during Hurricane Dorian showed the modeled subsurface temperature and in situ data only two tenths of a degree apart.
New Satellite Imagery Approach Offers Faster Insights After Storms
The health of tropical and subtropical coastlines, particularly mangrove wetlands, is key to supporting local communities, providing storm buffering, essential wildlife habitat, and more. In Fiscal Year 2020, the Marine Biodiversity Observation Network initiated a collaboration between Rookery Bay NERR and Jobos Bay NERR in Puerto Rico, which are dominated by mangrove habitat and impacted by severe storms, to identify research needs and management options for enhanced recovery and resilience.
This graphic shows the path of Hurricane Irma (red) along with the boundaries of Rookery Bay NERR (yellow), the overlapping national wildlife refuge, and a neighboring state park that comprise the area assessed by this new process. Credit: Dr. Matt McCarthy (Oak Ridge National Laboratory).
 An official website of the United States government.

Social