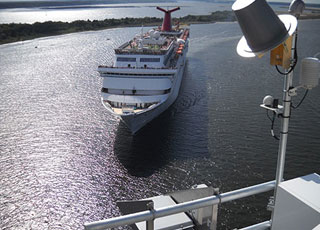
NOAA PORTS® (Physical Oceanographic Real Time System) is an integrated system of oceanographic and meteorological sensors that provides mariners with reliable real-time information about environmental conditions in a seaport, greatly enhancing the safety and efficiency of maritime commerce. On July 23, 2014, NOAA's Center for Operational Oceanographic Products and Services (CO-OPS) inaugurated a new PORTS® – the nation's 23rd and second largest – in the Port of Jacksonville, Florida.
Jacksonville ranks as the number-one vehicle export port in the nation, and is the top container port in Florida. Approximately 65,000 Floridians have jobs directly or indirectly related to the port, which channels around $19 billion into the U.S. economy every year. The new PORTSdirectly benefits commercial and recreational mariners in the dynamic St. John's River. It includes a broad suite of operational sensors that measure water levels, currents, under-bridge clearance, visibility, salinity, and meteorological conditions. Jacksonville PORTS® also supports hurricane response including storm-surge forecasts, real-time storm-surge monitoring, and evacuation planning, as well as studies of river ecology and health.

NOAA's Center for Operational Oceanographic Products and Services (CO-OPS) maintains a national network of Operational Forecast Systems (OFS) in commercially and recreationally important estuaries around the nation for the purpose of providing science-based predictions about current and future environmental conditions (e.g., water levels, currents, wind speed and direction). These predictions – both 6-hour nowcasts and forecast guidance extending to 48 hours in most cases – support safe commercial navigation, recreational boating, fishing, storm tracking, hazardous materials response, and search-and-rescue operations.
CO-OPS released enhancements to the Northern Gulf OFS by adding two higher-resolution nested models for the northwest and northeast areas of the Gulf of Mexico. The enhancements provide higher-resolution water level, current, temperature, and salinity forecasts for Matagorda Bay, Galveston Bay, Sabine Neches, Calcasieu-Lake Charles, Gulfport, Pascagoula Bay, and Mobile Bay.
CO-OPS also released a new OFS for the San Francisco Bay region, providing reliable forecast guidance for both San Francisco Bay and the San Francisco Bay Entrance. In direct response to user requests, CO-OPS also upgraded its OFS in New York/New Jersey Harbor and in Florida's St. Johns River, extending their forecast horizons from 24 to 48 hours.
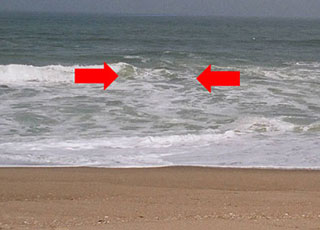
Oceanographers from NOAA's Center for Operational Oceanographic Products and Services (CO-OPS) developed a new rip current forecast model that is now being tested at National Weather Service (NWS) Weather Forecast Offices (WFOs) in Newport/Morehead City, North Carolina, and Miami, Florida. The new model, which improves upon the current one, uses wave field and water-level data to predict the likelihood of hazardous rip currents forming near shore. CO-OPS and NWS are collaborating with local lifeguards in both areas to test and validate the new model. NOAA sees great promise in the new model, which should enable its WFOs to issue more timely and effective beach hazard warnings.
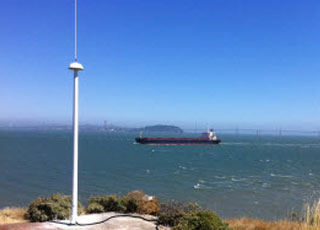
NOAA's Center for Operational Oceanographic Products and Services (CO-OPS), which has a long history of providing tidal current observations and predictions to the maritime community, released two significant enhancements to these products and services in FY 2013. The new web-based NOAA Tidal Current Predictions expands on traditional hard-copy Tidal Current Tables by allowing users to generate customizable predictions on demand in a variety of formats. The product offers daily, weekly, and yearly current predictions for more than 3,000 locations around the nation, as well as six-minute, half-hour, and hourly tidal current predictions for more than 500 locations. These up-to-date predictions incorporate new data as they are collected and analyzed by CO-OPS oceanographers.
The second new product—High Frequency Radar Surface Currents—provides near real-time surface current observations and tidal current predictions in coastal waters. Using data from the NOAA-led U.S. Integrated Ocean Observing System (IOOS®), this web-based product offers broad spatial coverage of surface currents in areas vital to the maritime community. It is currently available for Chesapeake Bay and San Francisco Bay. In addition to supporting safe commercial navigation and recreational activities, the product fosters search-and-rescue operations, hazardous materials spill response, harmful algal bloom monitoring, and fisheries management.
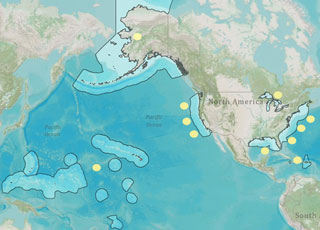
In June 2014, the NOAA-led U.S. Integrated Ocean Observing System (IOOS®) published a new rule in the Federal Register that established criteria and procedures to certify and integrate regional partners into U.S. IOOS in compliance with the Integrated Coastal and Ocean Observation System Act of 2009. Integration into the system formally establishes the role of the regions in U.S. IOOS and ensures that data collected and distributed by the regions are managed according to best practices as identified by NOAA.
Certification also offers the extension of the civil liability provision to certified regions, i.e., for purposes of determining liability arising from the dissemination and use of observation data, a certified region is considered part of NOAA, and its employees receive the same tort protections related to data usage as do federal employees.
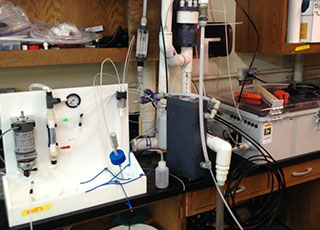
The NOAA-led U.S. Integrated Ocean Observing System (IOOS®) funded two marine sensor innovation projects in FY 14. The multi-year work will put promising technologies into faster use, enhancing scientific understanding of the coastal and marine environment to improve decision making.
The first project aims to transition new ocean acidification sensor technology to support shellfish industry monitoring. Scientists installed two sensors, known as "Burke-o-lators," at two shellfish hatcheries in California and one in Alaska. The technology complements ocean-acidification monitoring equipment already in use in Hawaii, Oregon, and Washington. A data portal for ocean acidification will launch in the coming year, making the data from all five states readily accessible.
The second project focused on transitioning the Environmental Sample Processor (ESP) for harmful algae bloom monitoring. Scientists deployed three ESPs in the Gulf of Maine between May and June 2014. The processors expanded the network from one instrument to four that operate concurrently at various locations along the coast. Throughout the deployment, the ESPs detected A. fundyense at levels that correlated with existing models.
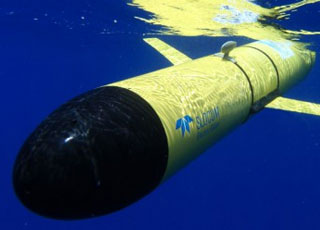
During hurricane season in the fall of 2013, partners of the U.S. Integrated Ocean Observing System (IOOS®) deployed 14 underwater robotic vehicles, called gliders, off the Eastern Seaboard. Each glider was in the water for 3-8 weeks. The large number of simultaneously deployed gliders provided unique data sets of both real-time and hindcast data, and demonstrated the potential of a national glider network. Part of the mission focused on collecting data to increase understanding of hurricane intensity, since the unmanned gliders can travel thousands of miles along the water column, collecting data in the middle of a storm and sending it back via satellite. The gliders also collected acoustic data about fish and mammal migrations to improve understanding of their behaviors. The gliders also produced a 3-D snapshot to improve researchers' understanding of the Mid-Atlantic Bight cold pool—a cold water mass that gets "trapped' along the ocean bottom and strongly influences ecosystems and important fisheries from Massachusetts to North Carolina. The project concluded by delivering real-time data to the National Weather Service's National Data Buoy Center, which makes the data available to the U.S. Navy and other users.

In FY14, the NOAA-led U.S. Integrated Ocean Observing System (IOOS®) led the nation's ocean observing community in data management. All 11 IOOS regions now serve data to customers in a common format, even when the data are collected and stored with different software. Through this effort, IOOS is making ocean information easier to access and use. Also this year, the 52North Initiative for Geospatial Open Source Software announced a major new release of its Sensor Observation Software (SOS), which incorporates IOOS-specific features. The partnership ensures a high-quality product for both 52North customers and IOOS data providers. Additionally, IOOS published its fourth (ocean temperature and salinity) and fifth (water-level measurements) Quality Assurance of Real Time Ocean Data (QUARTOD) manuals, which address standard quality assurance practices for oceanographic data variables.
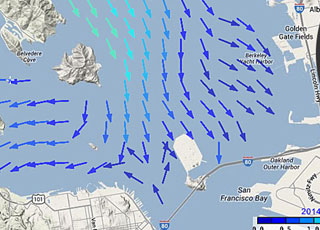
In FY 14, the NOAA-led U.S. Integrated Ocean Observing System (IOOS®) advanced the collection and use of surface current data with a new product called High Frequency (HF) Radar Surface Currents. The web-based product, produced in cooperation with NOAA's Center for Operational Oceanographic Products and Services (CO-OPS), provides near real-time surface current observations and tidal current predictions in coastal waters. Using IOOS data, the product offers broad spatial coverage of surface currents in areas vital to the maritime community. It is currently available for Chesapeake Bay and San Francisco Bay. In addition to supporting safe commercial navigation and recreational activities, the product fosters search-and-rescue operations, hazardous materials spill response, harmful algal bloom monitoring, and fisheries management.
Also this year, several IOOS regions collaborated to deploy a coordinated ocean observing network, the National Science Foundation's Project CONVERGE, along the Western Antarctic Peninsula. The network, which comprises a multi-platform field study including gliders, animal telemetry, acoustics, and HF radar, will increase scientific understanding of how local oceanographic processes influence ecosystems in this remote portion of the global ocean.
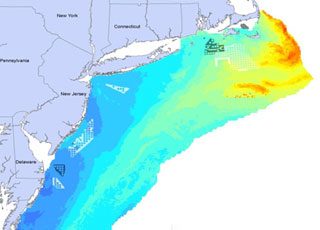
NOAA’s National Centers for Coastal Ocean Science (NCCOS) works closely with the U.S. Department of the Interior, including the Bureau of Ocean Energy Management (BOEM), the U.S. Geological Survey, and the U.S. Fish & Wildlife Service, to deploy mapping tools that support environmental assessment and planning for ocean energy development. Accurate maps and predictions of living marine resource distributions foster effective coastal and marine spatial planning, which reduces potential conflicts between human uses and sensitive marine ecosystems—thereby supporting healthy and resilient coastal communities and economies.
In FY14, NCCOS developed advanced statistical models of seabird and deep-sea coral distributions for the Atlantic Coast and the Gulf of Mexico. By merging large databases of seabird and coral observations with environmental data gleaned from NOAA satellites and ocean observations, NCCOS produced predictive maps of bird and coral distributions and disseminated them through a joint NOAA–BOEM Web service.
Also in FY14, a renewable energy transmission company used NCCOS’s coral distribution maps to help evaluate routing alternatives for a proposed undersea energy transmission cable into Maalaea Bay, Maui. The cable system under consideration would transmit renewable wind power generated in Maui County for consumption on Oahu, contributing to Hawaii’s 2030 goal of having 40 percent of its electricity sales come from renewable energy.
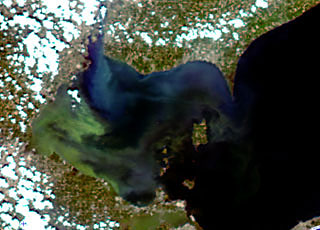
In August 2014, NOAA’s National Centers for Coastal Ocean Science (NCCOS) supported the response to a bloom of cyanobacteria, a toxic blue-green algae, that contaminated drinking water in Lake Erie. The bloom left nearly 400,000 people in Toledo, Ohio, without drinking water for two days.
NOAA’s weekly Lake Erie Harmful Algal Bloom Bulletin, produced by NCCOS and NOAA’s Great Lakes Environmental Research Laboratory, tracks the size and location of blooms and predicts their movement until the bloom season ends in the fall. This year, in response to requests from Ohio agencies, NOAA increased the frequency of the bulletins from once to twice a week. The August 1 bulletin caught escalation of the bloom and helped Toledo prepare for the hazard. NOAA currently provides, or is developing, harmful algal bloom and hypoxia (low dissolved oxygen) forecasts for Lake Erie, the Gulf of Maine, the Chesapeake Bay, the Gulf of Mexico, and the Pacific Northwest.
Also in FY14, NCCOS addressed paralytic shellfish poisoning (PSP)—a public health threat that affects Alaska’s residents more frequently than those residing anywhere else in the U.S. The remoteness of coastal communities in Alaska makes monitoring this threat challenging. NCCOS worked with the Food and Drug Administration and the biotechnology company Mercury Science to develop rapid laboratory and field test kits capable of detecting saxitoxins found in shellfish. Saxitoxins are produced by the microalgae Alexandrium and are the cause of PSP. Shellfish accumulate saxitoxins as they feed on Alexandrium. The saxitoxin field test can be used with minimal training, requires no expensive equipment, and is commercially available.
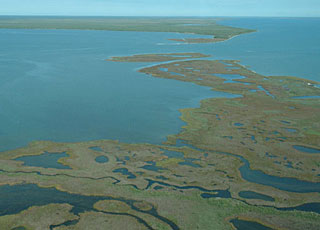
In FY14, scientists funded by NOAA’s National Centers for Coastal Ocean Science found that projected changes in coastal Gulf of Mexico land use and land cover (e.g., urban development) could increase the extent of storm surge flooding by up to 70 percent above the flooding that might be expected from projected sea-level rise alone.
The finding comes from a modeling study that investigated the ecological effects of sea-level rise in the Gulf of Mexico. The study is yielding predictive tools that assist coastal zone managers as they develop strategies to mitigate the future ecological and socioeconomic impacts of climate change.
The study is also the focal point of the Northern Gulf of Mexico Sentinel Site Cooperative, a federal-state partnership established to advance prediction and assessment capabilities for sea-level rise. The cooperative seeks to improve coastal data and research products to foster planning and adaptation to sea-level rise and inundation.
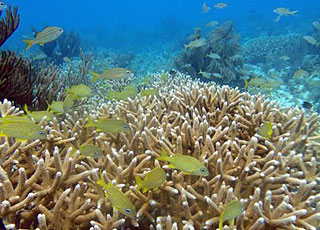
NOAA’s National Centers for Coastal Ocean Science (NCCOS) works with federal, state, and local management agencies to monitor and assess the condition of U.S. coral reef ecosystems within sanctuaries, reserves, and other special places. These productive ecosystems enhance biological diversity, fisheries, tourism, and cultural heritage, and protect shorelines from storm damage.
NCCOS and NOAA’s Southeast Fisheries Science Center (SEFSC) co-lead major components of NOAA’s National Coral Reef Monitoring Plan (NCRMP) – a framework for conducting sustained observations of biological, climate, and socioeconomic indicators at 10 priority coral reefs across the U.S. and its territories. In FY14, NCCOS and SEFSC conducted the first NCRMP fish and invertebrate monitoring missions, in the U.S. Virgin Islands and the Flower Garden Banks National Marine Sanctuary. Officials will use data from the missions to update management plans and ensure continued protection of coral resources at these locations. Also in FY 14, NCCOS conducted a biological assessment of the Florida coral reef tract and paired it with human-use information to develop management recommendations for the Florida Keys National Marine Sanctuary.
NCCOS is also studying the social and economic conditions of communities that depend on coral reefs in seven U.S. states and territories. In FY14, NCCOS scientists surveyed a random representative sample of the adult populations in American Samoa and South Florida. The survey data are being shared with local resource managers and other interested partners who will be able to use the information to improve a range of coral conservation efforts, including education and outreach initiatives and program evaluation.

Marine aquaculture has emerged as one of the fastest-growing activities in the coastal zone. Even as resource managers strive to end overfishing, the future seafood supply will rely on cultured seafood to meet growing demands. More than half of global seafood production already comes from aquaculture. While technological innovation has made it possible to grow seafood in the coastal ocean, managers must weigh economic benefits against environmental risks.
In FY14, NOAA’s National Centers for Coastal Ocean Science (NCCOS) published the report Marine Cage Culture and the Environment: Twenty-First Century Science Informing a Sustainable Industry, which analyzes environmental concerns related to marine cage culture practices around the world. This planning tool provides coastal managers and fish farmers with a global perspective on the range and intensity of potential environmental effects from cage aquaculture.
While not all practices were found to be sustainable, the research concludes that significant advancements of the past decade are addressing environmental concerns about marine fish farms. With proper coastal planning tools and environmental oversight, sustainable growth of aquaculture in the coastal ocean can occur – promoting higher seafood production, supporting the growth of coastal economies, providing healthier American diets, and increasing food security in the United States.
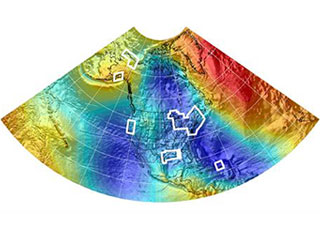
In June 2014, NOAA’s National Geodetic Survey released a new experimental geoid height model called xGEOID14B, which spans one-quarter of the Earth’s surface. The model represents a significant step toward defining a new regional vertical datum and contributing to a worldwide height system. Covering Hawaii, Alaska, Puerto Rico, and the U.S. mainland and incorporating satellite, airborne, and surface gravity data, the new geoid was tested by surveyors, engineers, geographic information specialists, and others interested in defining accurate heights. NOAA collaborated with Canada, Mexico, Central American and Caribbean nations, and Denmark (for Greenland) to provide the unified height model. It has already improved forecasters’ ability to predict the effects of storm surge, and will be used for a variety of scientific, engineering, disaster mitigation, and emergency response purposes.
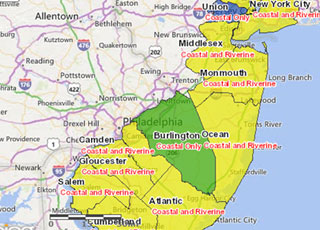
In FY 14, in response to post-tropical cyclone Sandy, a team of federal policy and science experts led by NOAA’s Office for Coastal Management created an interactive sea-level rise mapping and calculator tool to help people identify and prepare for flooding related to rising sea levels. Recognizing the need to inform Sandy-related rebuilding decisions, the tool was ready in a remarkably short time. The team’s efforts were recognized with the 2013 Presidential GreenGov Awards’ “Climate Champion” designation.

In FY 14, in response to post-tropical cyclone Sandy, NOAA’s Office for Coastal Management developed a new online tool called the Coastal Flood Exposure Mapper that gives coastal New York, New Jersey, Delaware, and Pennsylvania easy access to community-level flood information. The tool displays county-level data about shallow coastal flooding, flood zones, storm surge, sea level rise, and a composite view of flood hazards. An added bonus is the ability to include important data such as population centers, infrastructure, and evacuation routes. Maps can be downloaded or shared online. In addition to the Mapper helping make communities safer, it also helps them take actions to raise their scores in the National Flood Insurance Program’s community rating program. Plans are under way to expand the reach of the tool to include the rest of the East Coast and the Gulf of Mexico.

Understanding how land cover is changing is an important component of successful coastal management. While coastal communities have used NOAA’s land cover data for this purpose for more than 20 years, NOAA’s Land Cover Atlas, updated by the Office for Coastal Management in FY 14, makes it even easier for communities to access and understand the data. A fact that the updated Atlas uncovered is that 8.2 percent of the nation’s coastal and Great Lakes regions experienced land cover or land use changes from 1996 to 2011. That’s a total of 64,975 square miles—an area larger than the state of Wisconsin. Much of this change is related to new development. In FY 14, land cover data helped officials assess sea level rise hazards in Florida’s Miami-Dade County, determine high-risk areas for stormwater runoff in southern California, and find the best habitat restoration sites in two Great Lakes watersheds.

The Social Coast Forum, developed by NOAA’s Office for Coastal Management, fills a unique niche by bringing together coastal practitioners and social scientists to advance coastal management goals. Participants shared information and lessons learned based on their social science and coastal management experiences. The forum focused on the ways that values and beliefs shape coastal policy and decision-making. Session topics included community benefits of green infrastructure, communication strategies and frameworks for adaptation, public perception of climate change, informing fisheries management with social science, and understanding stakeholder motives. More than 100 presentations, 32 roundtable demonstrations and discussions, and 14 entries in the visual gallery made the 2014 forum even more popular than the first one, held in 2012.
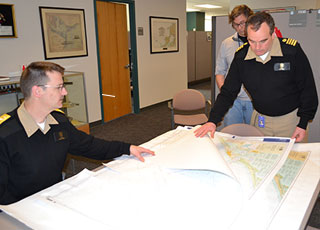
NOAA’s Office of Coast Survey (OCS), which creates and maintains the nation's suite of 1,000 nautical charts of U.S. coastal waters, ceased to print traditional lithographic (paper) nautical charts in FY 14. NOAA will continue to produce other forms of nautical charts, including the increasingly popular POD (Print-on-Demand) charts, which are updated paper charts available from NOAA-certified printers; and the new full-scale PDF (Portable Digital Format) nautical charts, available for free download on a trial basis. NOAA electronic navigational charts (NOAA ENC®) and raster navigational charts (NOAA RNC®), which are used in a variety of electronic charting systems, will continue to be updated weekly and made available for free download from the OCS website.
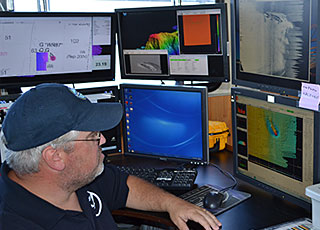
In FY 14, NOAA’s Office of Coast Survey improved its Wrecks and Obstructions Database, giving the public easy access to nearly 20,000 records of submerged wrecks and other obstructions to navigation within U.S. maritime boundaries. The new service is an upgrade of a wreck database first established in 1981: It now includes all of the wrecks that are mapped on NOAA’s electronic navigational charts, and provides the data in formats that can be used in GIS software programs, Google Maps, and Google Earth. The data includes the position of each feature (latitude and longitude) and, when available, a brief description. While the locations of wrecks and other obstructions have always been important for safe coastal navigation, people interested in shipwrecks for other reasons, such as for marine archeology, recreational diving, salvage operations, and fishing, now have thousands of new records to explore.

NOAA’s Office of Coast Survey (OCS) and NOAA’s Center for Operational Oceanographic Products and Services made two Operational Forecast Systems (OFS) available to the public in FY 14. The San Francisco Bay OFS provides users with nowcasts (analyses of near-present conditions) and forecast guidance out to 48 hours for water levels, currents, water temperature, and salinity. A similar forecast system was implemented for the northern Gulf of Mexico. Additionally, OCS, in collaboration with the National Weather Service’s National Center for Environmental Prediction, implemented the Extratropical Surge and Tide Operational Forecast System for the Pacific (ESTOFS Pacific). This OFS covers the U.S. West Coast, the Gulf of Alaska, and Hawaii. ESTOFS Pacific provides 180-hour forecasts of water levels caused by storm surge, astronomical tides, and the combined effects of storm surge and tides. In addition to providing weather forecasters with guidance on storm surge and tidal water levels, ESTOFS Pacific is also used by NOAA's WAVEWATCH III wave model for coupling wave and water level predictions.
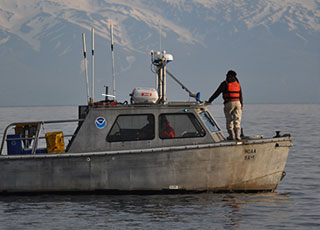
In FY 14, NOAA’s Office of Coast Survey issued a new nautical chart for the Arctic’s Delong Mountain Terminal, a shallow-draft port that services the Red Dog Mine on Alaska’s northwest coast. New Chart 16145, which fills in historically sparse depth measurements using recently acquired survey data, is important to the Arctic economy and will help improve maritime safety and efficiency. Zinc and lead are mined at Red Dog, which is one of the world’s largest producers of zinc concentrate. The terminal’s shipping season lasts only about 100 days, so shipping efficiency is vital. This is the third new Arctic chart that NOAA has issued in as many years, the others being for Kotzebue Harbor in 2012 and Bering Strait North in 2013.
NOAA’s Office of Response and Restoration (OR&R) has a long history of developing tools for first responders to chemical releases. First responders worldwide use ALOHA (Areal Locations of Hazardous Atmospheres), a model developed jointly by OR&R and the U.S. Environmental Protection Agency’s Office of Emergency Management, to quickly determine the potential size of a toxic plume from a hazardous materials accident. In FY 14, scientists from OR&R and NOAA's Air Resources Laboratory (ARL) successfully combined features from ALOHA with HYSPLIT (Hybrid Single-Particle Lagrangian Integrated Trajectory), one of ARL’s primary models for plume prediction. The project combines the best capabilities of both models to provide a more robust forecasting tool for hazardous chemical incidents. The resulting tool (HYSPLIT with inclusion of ALOHA chemical source term algorithms) is now available to National Weather Service Weather Forecast Offices nationwide.
 An official website of the United States government.
Here's how you know we're official.


