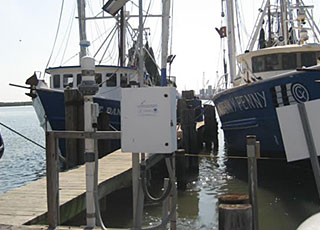
Two southeast Louisiana shipping hubs, critical to the U.S. economy, became part of NOAA's Physical Oceanographic Real-Time System (PORTS®). The new multi-sensor systems can increase navigation safety and allow for increased efficiency on ships transiting through the Port of Morgan City and Port Fourchon, Louisiana. PORTS® is an integrated system of oceanographic and meteorological sensors that provide mariners with accurate and reliable real-time information about environmental conditions in seaports. Morgan City is a newly established foreign trade destination, while Port Fourchon is one of the nation's busiest energy ports, servicing 90 percent of the deepwater Gulf of Mexico oil and gas industry. Each day Port Fourchon handles more than 20 percent of the nation's energy supply. Economic benefit studies from four PORTS® locations around the U.S. have shown a 50 percent reduction in groundings and over $50 million in economic efficiency benefits every year.
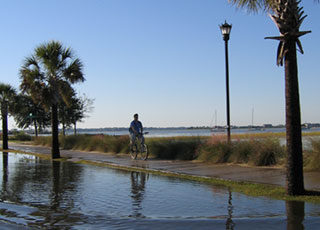
Coastal communities can start preparing now for increased flooding caused by sea level rise and storms with new coastal intelligence provided this year through the Center for Operational Oceanographic Products and Services (CO-OPS). CO-OPS issued an update to its 2014 report,Sea Level Rise and Nuisance Flood Frequency Changes around the United Statesthat examines the current state of climate-driven "nuisance flooding" and provides an outlook for 2015. This information helps coastal communities become more resilient by allowing them to assess flooding risk and develop ways to mitigate and adapt to the effects of sea level rise. CO-OPS, in partnership with National Geodetic Survey, U.S. Integrated Ocean Observing System Program, Office of Coast Survey, and Office for Coastal Management also expanded an inundation benchmark project to Norfolk, VA and Beaufort, NC that will allow weather forecasters and emergency management officials to use well-known landmarks, such as statues, as a way to better visualize and communicate water levels and impacts during floods. CO-OPS maintains the nation's only water level observation system and is the authoritative source for sea level data. As of this year, more than 140 of the existing 210 water level gauges have operated for more than 30 years, providing consistent high quality records of sea level change for the nation through sea level trends and statistics put out through CO-OPS Sea Level Trendswebsite.
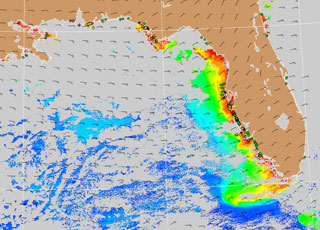
Red Tide Forecasts for Florida and Texas will now be even more accurate thanks to an improved method of forecasting that will allow NOAA scientists to see more clearly where the harmful algal blooms (HAB) that cause this phenomenon are located. This helps local residents and visitors make informed decisions about their recreational choices during a HAB event and aids public health managers who coordinate response efforts and mitigate the effects of Red Tide. In Florida and Texas, Red Tide is primarily caused by the harmful algae species, Karenia brevis and can cause severe respiratory irritation in people, produce large fish kills and discolored water along the coast. NOAA uses a combination of satellite imagery and water samples collected by local partners to forecast the location and intensity of Red Tide events. NOAA's HAB forecasts can give public health officials a much better idea of the areas impacted by a bloom. This product is part of NOAA's Harmful Algal Bloom Operational Forecast System, which includes partnerships across NOAA's line offices.
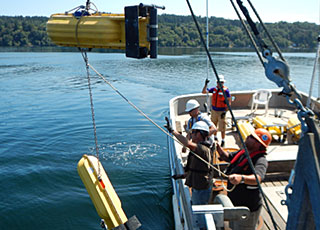
The Center for Operational Oceanographic Products and Services (CO-OPS) updated the tidal current predictions for Casco Bay, Maine this year. These updates ensure commercial and recreational mariners have the most recent tidal and current information for safe marine navigation. CO-OPS also began the process of updating current predictions for Puget Sound this year by beginning a multi-year survey. In order to provide the most accurate predictions possible, CO-OPS must periodically resurvey various coastal and estuarine locations. For example, the NOAA tidal current predictions for the Puget Sound region are presently being generated from limited amounts of data collected in the 1930s-1960s. With the improvements in measurement and computing technology we have today, the accuracy of these modern predictions are significantly improved once they are updated. NOAA has been providing tidal and current prediction information to mariners since 1865 and still provides this service to the nation today through a variety of media that are broadly redistributed through publications, newspapers, television, radio, and local media.
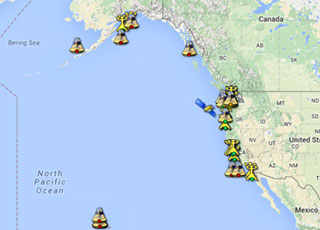
The IOOS Pacific Region Ocean Acidification Portal was launched in October 2014. Funded through a grant award from U. S. IOOS' Ocean Technology Transfer Project in collaboration with NOAA's Ocean Acidification (OA) Program, this portal provides shellfish growers, researchers and others interested in ocean acidification with access to comprehensive, real-time ocean acidification data from Alaska, Hawaii, Oregon, California and Washington State.
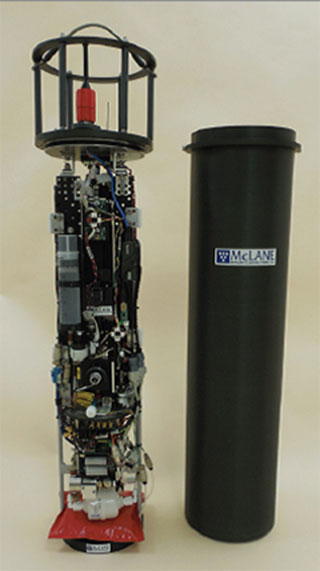
This grant award also expanded monitoring of ocean acidification in the Pacific Ocean region. Alaska, Pacific Northwest, Central and Northern California, and Southern California IOOS regions deployed ocean acidification monitoring sensors, developed by Dr. Burke Hales at Oregon State University, at five oyster farms and hatcheries in California, Oregon, Washington, and Alaska. Data from monitoring equipment enables shellfish growers to assess how the chemical make-up of the water will affect shellfish productivity and adapt their aquaculture practices to minimize impacts from ocean acidification to their operations.
In FY 2015, the U.S. IOOS Program (IOOS®), in partnership with NOAA's Ocean Acidification (OA) Program, continued its multi-year Ocean Technology Transition project to transition innovative marine observing technologies to improve the Nation's understanding of coastal stressors and ecological change. Three projects totaling $1.2 million were awarded in 2015:
The first of these is a two year project with the University Of Hawaii Institute Of Marine Biology (UH) to deploy an operational Shark Telemetry System for the Hawaiian Islands. The project will attach environmental sensor tags on tiger sharks, six gill, and hammerhead sharks in this region. Data from the sharks will be acquired via the Argos satellite system and through land-based relay receivers installed on several islands as part of this project.
The second of these awards went to the Woods Hole Oceanographic Institution (WHOI) to expand the Imaging Flow CytoBot's (IFCB) potential for operational use by deploying it on autonomous vehicles in the Gulf of Maine and in the Gulf of Mexico. These deployments will enable high resolution plankton studies with both long duration and spatial coverage. Expected benefits from the proposed work are improved early warning of Harmful Algal Blooms (HAB) in the Gulf of Maine and the Gulf of Mexico
The third award was granted to the University of New Hampshire (UNH) to expand the quantity and quality of ocean acidification (OA) monitoring across Northeastern U.S. coastal waters. In all, five different deployment platforms will be used to enhance ocean acidification monitoring within the Northeast Coastal Acidification Network (NE-CAN) with significant improvement in temporal and spatial coverage.
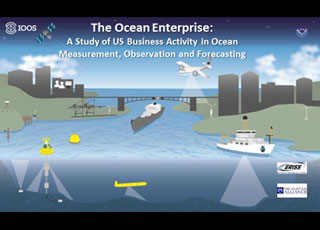
The U.S. IOOS Program recently sponsored The Ocean Enterprise: A Study of US Business Activity in Ocean Measurement, Observation and Forecasting. This a first of its kind study to identify and dissect the scale and scope of the United States private sector activity in support of ocean measurement, observation and forecasting, and the use of ocean information to deliver safety, economic and environmental benefits.
Ocean information is important for delivering a range of safety, economic and environmental benefits, underpinning the blue economy. The means to collect and use ocean data constitutes a significant business enterprise and one in which the United State is an acknowledged world leader.

Using data from the U.S. IOOS Program, the Office of Coast Survey added New York Harbor as the third site for the High Frequency (HF) Radar web product, joining lower Chesapeake Bay and San Francisco Bay. HF Radar provides near-real time surface current observations and tidal current predictions in estuarine and coastal locations.The product offers broad spatial coverage of surface currents in areas vital for marine navigation. The HF Radar web product also supports NOAA's Physical Oceanographic Real-Time System (PORTS®), a system that provides real-time water level, currents and meteorological observations for safe navigation.
IOOS also published the sixth and seventh Quality Assurance of Real Time Ocean Data (QARTOD) manuals addressing standard quality assurance practices for oceanographic data variables. One of the manuals published this year provides guidance to the U.S. IOOS Regional Associations and the wind community at large for the real-time quality control of wind speed, direction, and gust measurements using a standard process. The other provides guidance to the U.S. IOOS Regional Associations and the water-quality community at large for the real-time quality control of ocean optics measurements using an agreed-upon, documented, and implemented standard process. A third manual, providing guidance on real-time quality control of dissolved oxygen measurements was also updated.

The U.S. IOOS Program and The Office of Naval Research (ONR) working with Stanford University, University of California (UC) and the NOAA Southwest Fisheries Science Center Environmental Research Division launched the national Animal Telemetry Network Data Assembly Center to provide reliable and accurate biological and physical observation data provided tagged animals from nearly 50 different species.
The network provides data that can be used in modeling ocean dynamics, defining critical ocean habitats, and forecasting marine ecosystem features to support US IOOS societal benefits needs. These needs include improving predictions of climate change, more effective protection and restoration of healthy coastal ecosystems and enabling the sustained use of ocean and coastal resources.
In FY15, NCCOS Ecological Effects of Sea Level Rise (EESLR) program funded research to assess the vulnerabilities of coastal communities and ecosystems to sea level rise, coastal erosion, and severe storms. This research improved two models and initiated three partnerships to apply improved models in land planning and flood preparedness efforts in Central Florida, Virginia and the Northeast region of the U.S.These models illustrate the need to incorporate sea level rise, storm surge, and landscape change in future assessments of coastal infrastructure.
NCCOS also awarded $1.2M for coastal resilience research in FY15, including a socioeconomic analysis of the benefits of natural infrastructure, modeling the ability of marshes to attenuate high tides and storm surge in North Carolina, beach and dune modeling in North Carolina, advancing marsh modeling in San Francisco Bay, and improved modeling to guide conservation planning along the coast of Hawai'i.
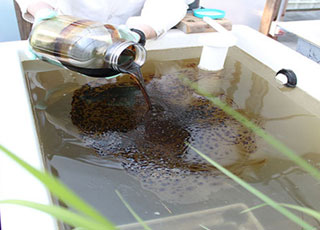
NCCOS continues to support the Natural Resource Damage Assessment (NRDA) of the Deep Water Horizon (DWH) oil spill by quantifying the spill's impacts to bottlenose dolphins, benthic organisms and sediment quality, and is improving NOAA's oil spill mitigation capabilities by examining the effects of oil dispersants on estuarine animals.
In FY15, NCCOS scientists reported that persistent organic pollutants were likely not a contributing factor to the poor health and increased mortality seen in some populations of bottlenose dolphins following the oil spill. NCCOS worked with other NOAA offices to develop guidelines for assessing injury to marine mammals from oil spills. These studies documented spill-related effects on benthic invertebrate communities and sediment quality in the vicinity of the DWH wellhead, which included a decline in the condition of soft corals. Results of these studies are supporting the development of a Damage Assessment and Recovery Plan (DARP) as part of the ongoing DWH NRDA process.
Additionally in 2015, using a simulated saltmarsh, NCCOS determined dispersant and dispersed oil toxicity thresholds in six estuarine species. Results are being used to predict the impacts of dispersants, to support recovery assessments, and to support decisions on dispersant use in future oil spill events.
NOS uses its online presence to reach the ocean-interested public. Traffic to the NOS website increased 25.5% during FY 2015 compared to FY 2014. The number of Facebook "likes" grew more than 20% (from 52,640 to 64,413) and the number of Twitter followers grew more than 25% (from 101,807 to 129,480). During its 30-day National Ocean Month campaign, NOS reached more than 1 million users on Facebook. NOS continues to explore new platforms to reach a greater audience. In March, NOS completed its first Reddit Ask Us Anything with two scientists on an expedition in the Caribbean aboard the NOAA Ship Nancy Foster. The session generated more than 200 questions and was upvoted 89% of the time. In June, NOS launched a presence on Instagram, which is growing steadily.
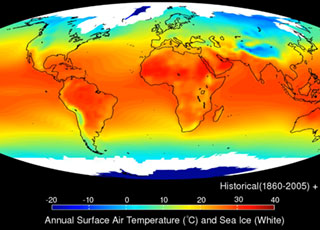
A series of five regional workshops for more than 400 formal and informal educators was sponsored by NOAA's Planet Stewards Education Project, led by NOS CED. This effort supports OSTP's Climate Education, Literacy and Training initiative announced in December. The workshops were developed with Federal, State, and NGO partners in Chicago, IL; Seattle, WA; St. Petersburg, FL; Boulder, CO; and Silver Spring, MD.
Each workshop focused on regional and/or topical impacts of climate change to connect educators and their audiences to the best-available, science-based information and resources about climate change. Attendees interacted with climate science, education and communication experts, participated in hands-on education activities and explored innovations in Earth-system research. Post workshop evaluations showed that attendees were significantly more knowledgeable in workshop content, and all planned to address the topics presented in the workshops within the next year by sharing the information and resources with over 10,000 people including their colleagues, youth and adults in formal and informal education settings.
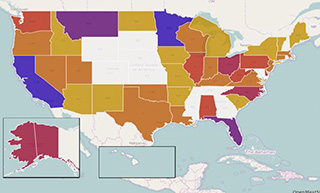
The National Geodetic Survey (NGS) hosted the 2015 Geospatial Summit in Arlington, Virginia, to share plans to release new geodetic datums in the year 2022. Huge benefits are associated with the adoption of the new datums. The new vertical reference system is estimated to produce $522 million in annual economic benefits to the nation, with approximately $240 million saved from improved floodplain management.
During the Summit, NGS discussed the tools available for its customers to transition to the new datums and shared strategies to enable the mapping and surveying communities to prepare well in advance of the changes. Surveyors; GIS professionals; federal, state, and local government agencies; and others then had the opportunity to comment and ask questions regarding the effect the new datums will have on their work.

The National Geodetic Survey (NGS) initiated a 2015 GPS on Bench Marks Campaign as part of National Surveyors Week. The campaign increased awareness about professional surveying while improving the National Spatial Reference System (NSRS)—the coordinate system that provides latitude, longitude, height, scale, gravity, and orientation for the United States and delivers over $2.4 billion in potential annual benefits to the U.S. economy.
NGS will use data received from the campaign to improve the next vertical positioning model and facilitate conversions to the new vertical datum in 2022. While observations made with survey-grade equipment were preferred, NGS encouraged geocachers and anyone with a GPS-enabled phone or hand-held device to join in.
To promote the campaign, NGS held a webinar for over 400 attendees and developed a web map/planning tool. The event produced noteworthy news stories in industry-affiliated press and an article in the Wall Street Journal.
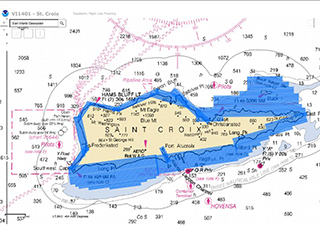
The National Geodetic Survey (NGS) completed a three-week project in St. Croix, U.S. Virgin Islands to collect airborne topographic-bathymetric (“topo-bathy”) light detection and ranging (lidar) data and imagery of the shoreline, using the NOAA Twin Otter aircraft. The survey supports data requirements for both NOS’s Office of Coast Survey (OCS) and the National Centers for Coastal Ocean Science (NCCOS) and will help update charted depths for most of the island. The last survey of the island was acquired via single-beam sonar in 1980.
Topo-bathy lidar acquires land values—or heights—and depths under the water surface. It is used to supplement hydrographic survey data for updating NOAA Nautical Charts and to enable NCCOS to create habitat maps.
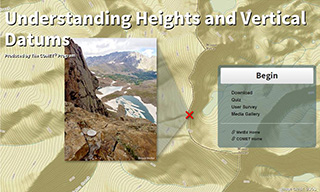
In a FY15 collaborative effort between the National Geodetic Survey (NGS) and The COMET® Program, the first in a series of training lessons for scientists, engineers, and mapping professionals was developed and released. The lesson provides a basic understanding of vertical datums and how to choose the appropriate datum for a given application. A conceptual understanding of ellipsoidal, geopotential, and tidal datums was also introduced.
Accurate heights are vital for emergency preparedness, floodplain mapping, restoration, urban planning, and more. This training lesson represents NGS’s commitment to engaging and educating its customers for a successful transition to the new vertical datums NGS plans to release in 2022. This interactive presentation provides participants with knowledge to better understand the impact of the new datums. NGS has received positive feedback and plans to add to its educational library.
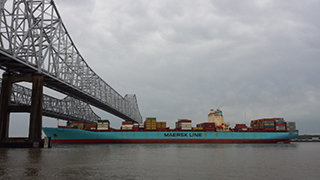
The National Ocean Service's navigation, observation, and positioning offices (OCS, IOOS®, CO-OPS, NGS), and the National Weather Service, partnered with the Port of Long Beach and a private company in a pilot project to develop a highly accurate underkeel clearance system for ships using the port channel. The resultant decision-support tool will allow large ships to access the port with a high degree of confidence that their keels will clear the channel. (Bottom clearance for the largest ships can be less than one meter.) Shipping companies will save an at least $10 million per year when they no longer need to offload cargo from vessels offshore before they enter the port. The project provides high-resolution hydrographic surveys, wave buoys, water levels, and the development of a new nearshore wave prediction system. Navigational software manufacturers can use the data along with other NOAA data streams, such as wave forecasts and water levels, to visually portray real-time and forecasted depths, as demonstrated by a "precision navigation" demonstration created by Coast Survey. This pilot project is a model for future collaborations in other seaports where integration of high-resolution data and products can improve navigation safety margins. This next generation of navigation services will give ship operators, port managers, pilots, and shipping companies the ability to conduct safe, efficient, and around-the-clock operations regardless of ocean conditions.

Seeking to improve nautical charts for maritime traffic transiting the increasingly busy Straits of Florida, the Office of Coast Survey met with Cuba's National Office of Hydrography and Geodesy to resolve charting challenges that interfere with smooth navigational transitions from Cuban waters to U.S. waters. Officials met in Havana, Cuba to initiate discussions and collaboration on reducing gaps and improving coverage of international and domestic charts. The hydrographers of both countries can now coordinate chart coverage and data acquisition.
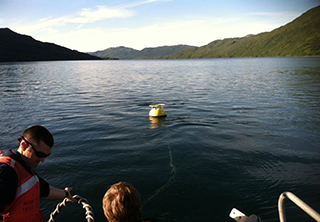
NOAA's Office of Coast Survey, in cooperation with the Center for Operational Oceanographic Products and Services and the National Geodetic Survey, completed a demonstration project to improve system operations and water level measurement capabilities of a GPS-equipped buoy system. These efforts originally began with the Small Business Innovative Research (SBIR) program, followed by collaborative work between Coast Survey and the United States Navy, resulting in the procurement of two demonstration buoys. The decision in 2015 to approve the GPS buoy system for use in hydrographic surveying applications culminated a five-year evaluation project across distinct oceanographic environments in the National Water Level Observation Network. The Coast Survey GPS buoy system is now incorporated in hydrographic survey project planning for three operational scenarios: tidal reconnaissance, tidal datum computation, and water level determination.
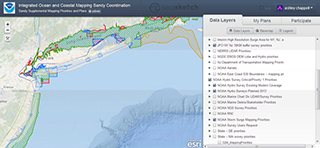
To improve coordination of data acquisition in U.S. waters, NOAA's Integrated Ocean and Coastal Mapping Program (IOCM) expanded the scope of its ocean and coastal mapping SeaSketch site. The site also includes information on topographic data acquisition plans generated by the 3D Elevation Program, a terrestrial-focused working group that complements the Interagency Working Group on Ocean and Coastal Mapping. The U.S. federal mapping coordination site now displays federal and state mapping requirements, plans, and priority areas of many partners on various levels, which will improve decision making throughout all levels of government.
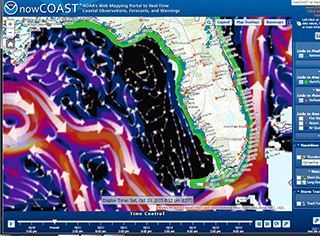
NOAA's Office of Coast Survey released a new version of nowCOAST, a GIS-based online mapping portal that provides near-real-time observations and forecasts for coastal and marine weather, and oceanographic and hydrologic conditions. The new version provides more frequent updates. It also offers a visual point-and-click access to 60 NOAA data products and services, such as the latest National Weather Service watches, warnings, and advisories for hazardous conditions; GOES water vapor imagery; model forecast guidance from additional NOS oceanographic forecast systems; higher temporal resolution of weather and marine forecasts; and satellite-emulated lightning strike density. For advanced users, the new version now provides access to nowCOAST's map layers via time-enabled REST and Web Map Services.
Coast Survey implemented this new nowCOAST version in collaboration with the National Weather Service GIS hosting facility in College Park, Maryland. This implementation ensures availability of nowCOAST's map viewer and map services 24 hours a day, 7 days a week for emergency management, homeland security, search and rescue, HAZMAT response, and marine operations.
NOAA’s Office for Coastal Management has developed three new green infrastructure products are helping coastal communities use natural and nature-based systems to absorb and filter excess water and reduce flooding. These new offerings include an interactive animation that illustrates how green infrastructure can help protect communities from storm impacts; a guide for spatial analysts who want to incorporate green infrastructure into mapping efforts; and a cost-benefits process that people are using to determine what green infrastructure strategies make the most sense for their community. These additions join other products featured on the green infrastructure section of the Digital Coast website.
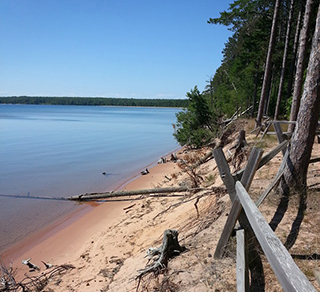
Fluctuating levels in the U.S. Great Lakes are resulting in renewed community interest in topics such as encouraging sustainability, planning for infrastructure, conserving habitat, and zoning restrictions. Helpful in these discussions is a new NOAA tool developed for this purpose, the Lake Level Viewer. This tool portrays the impacts of lake level change on coastal areas and resources. Tool users download the data and access services within the tool for more in-depth analysis. This easy-to-use tool was designed and tested with input from Great Lakes stakeholders. It was selected as a Site of the Month by the Great Lakes information Network, which averages 4.5 million monthly hits. Designed by the Office for Coastal Management and funded by President Obama’s Great Lakes Restoration Initiative, the viewer complements the Great Lakes Environmental Research Lab’s Water Level Dashboard.
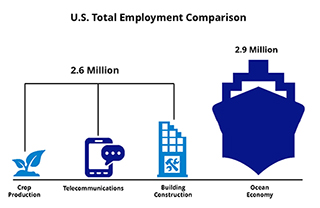
Understanding the value of the ocean is a crucial component of community decision making, yet the economic data we need are not always readily available or easy to understand. NOAA’s ENOW (Economics: National Ocean Watch) data were developed in response to this need. A 2012 fact pulled from the website, for instance, says the U.S. ocean and Great Lakes economy grew by 10.5 percent in real gross domestic product (GDP)—more than four times as fast as the U.S. economy as a whole. More facts, as well as the latest data and trends, soon will be online in the NOAA Report on the U.S. Ocean and Great Lakes Economy. These and other economic-centered products are available from NOAA’s Digital Coast, which is provided by the NOAA Office for Coastal Management.

NOAA scientists continue to deliver products and tools to help resource managers predict and prepare for the ongoing and destructive global coral bleaching event. In early 2015, based on data from satellites and climate models, NOAA scientists sounded the alarm that corals in the Pacific and other regions were at risk for bleaching. Months later, more warnings followed for coral reefs in much of the Northern Hemisphere, which prompted NOAA to declare the onset of the third recorded global coral bleaching event. In addition to forecasting thermal stress events and bringing them to worldwide attention through the media, the NOAA Coral Reef Conservation Program released its strategy to reduce the impact of climate change and ocean acidification to coral reefs, as well as a list of the top 10 things resource managers can do to prepare and respond to bleaching events. Researchers also contributed to a study that projects the impacts of climate change on the world's oceans and the goods and services they provide. NOAA has identified climate change as a key global threat to coral reef ecosystems. The Coral Program works across federal agencies and with local, regional, and international partners to coordinate efforts to address the impacts of climate changes and foster more resilient coral reefs.
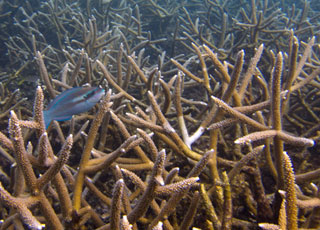
Florida's Biscayne Bay and Puerto Rico's Northeast Marine Corridor and Culebra Island have been named as NOAA Habitat Focus Areas—places where the agency can maximize its habitat conservation investments and management efforts to benefit marine resources and coastal communities. Biscayne Bay is threatened by harmful algal blooms, and an investigation of water quality conditions that promote these blooms is needed to reduce nutrient inputs where possible. The Northeast Marine Corridor and Culebra Island are home to a diversity of coral reef species, mangroves, seagrass beds, and other habitat types. NOAA's Coral Reef Conservation Program is actively working with teams across NOAA line offices and partners in Puerto Rico to develop a strategy to address the top threats to the region's unique habitats. The recognition of Biscayne Bay and the Northeast Marine Corridor and Culebra Island as Habitat Focus Areas under NOAA's Habitat Blueprint allows the agency to maximize its habitat conservation efforts in these areas. The Coral Reef Conservation Program is leading much of NOAA's efforts to support ridge-to-reef science and place-based conservation in both areas, and Puerto Rico in particular.
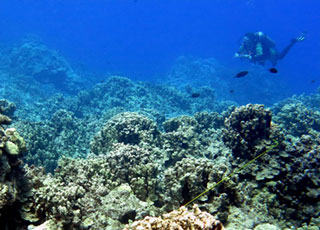
NOAA scientists and partners in the Commonwealth of the Northern Mariana Islands developed innovative techniques to evaluate coral reef resilience. An assessment of 78 coral reef sites off Saipan, Tinian, Aguijan, and Rota revealed that Saipan, the most populated island, is home to the most resilient reef sites in the study. Sites off Rota, the most isolated island, ranked low in terms of resilience. Study findings were used to identify priority sites for six types of management actions including: conservation, land-based sources of pollution reduction, and fishery management and enforcement. The data also indicate that the presence of herbivores, coral recruitment and the exchange of coral and fish larvae between islands are key drivers of resilience. Reefs in the commonwealth experienced widespread bleaching in 2013 and 2014, but were spared during the 2015 global bleaching event. The assessment results supported by the NOAA Coral Reef Conservation Program provide an innovative tool to help officials implement effective resilience-based management strategies. The methodology has global relevance as efforts move increasingly toward managing for resilience. The commonwealth is home to diverse coral reef ecosystems that provide residents with many goods and services. This approach to evaluating reef resilience will provide much-needed guidance on where and what type of conservation actions will ensure the commonwealth has healthy reefs in the future.
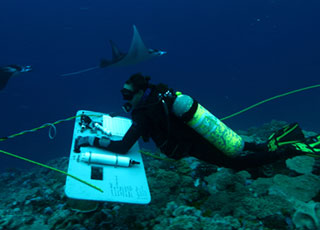
Scientists continued to collect biological, climatic, and socioeconomic data to measure changes in U.S. coral reef ecosystems as part of the National Coral Reef Monitoring Program. In the U.S. Pacific Islands of American Samoa and the U.S. Pacific Remote Islands Marine National Monument, NOAA scientists conducted hundreds of fish and benthic surveys and recovered and re-deployed instruments to assess impacts of ocean acidification and warming. In the Atlantic, experts gathered similar data at sites in the U.S. Virgin Islands and the Flower Garden Banks. Social science researchers focused on the connections between coral reef ecosystems and the people, their communities and economies by completing resident surveys in Hawaii and Puerto Rico. Teams established climate data collection sites in the Gulf of Mexico and the Atlantic and Pacific Oceans to support modeling efforts and to identify areas of reef resilience and vulnerability. Satellite remote sensing provided data across all U.S. reef areas, filling gaps between filed sampling sites. The National Coral Reef Monitoring Program is an integrated and focused monitoring effort with partners across the U.S. and its territories. Outcomes will help managers, decision makers, and communities better understand the condition of their resources and take effective place-based conservation actions. This effort is supported by the NOAA Coral Reef Conservation Program.
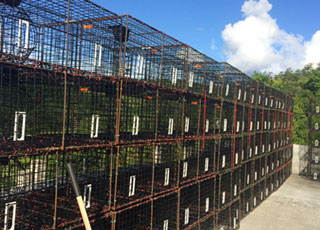
Fish traps are an economically important tool for local fishers in the U.S Virgin Islands, but they are generally considered a non-selective gear with high bycatch. Scientists and fishers cooperatively designed a more selective and efficient fish trap that reduces bycatch. NOAA and the St. Thomas Fishermen's Association partnered to conduct a series of experiments resulting in a final vent design that successfully maintained or improved catch rates while reducing capture of non-target and undersized species. This includes herbivorous species that, by grazing algae on the reef, play an important role in maintaining ecosystem balance and resilience. The unwanted fish escaped underwater before the traps were hauled to the boat, so the fishers spent less time handling unwanted fish before resetting their traps. Fishers across St. Thomas are adopting the new design and sharing results with neighboring fishing communities. This work, funded by the NOAA Coral Reef Conservation Program and others, demonstrates the effectiveness of scientists and fishers working together to come up with real-world solutions to fisheries challenges.
 An official website of the United States government.
Here's how you know we're official.


