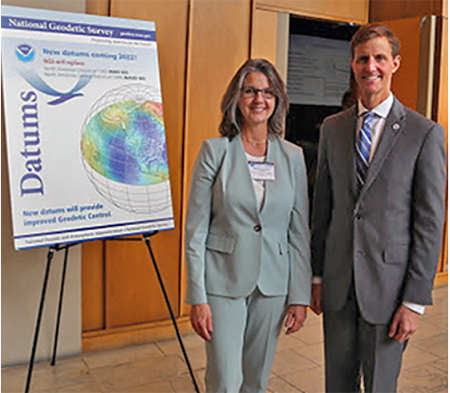
NGS Director Juliana Blackwell pictured with the 2019 Geospatial Summit’s Keynote speaker, RDML Timothy Gallaudet, PhD, USN Ret., Assistant Secretary of Commerce for Oceans and Atmosphere and Deputy NOAA Administrator.
NGS Hosts Geospatial Summit
SUPPORTS NOS PRIORITY: SAFE AND EFFICIENT TRANSPORTATION AND COMMERCE
From May 6–7, 2019, NOAA’s National Geodetic Survey (NGS) hosted the 2019 Geospatial Summit, providing a forum for NGS to share information with NOAA stakeholders about the planned modernization of the National Spatial Reference System (NSRS). NGS plans to replace the North American Datum of 1983 and the North American Vertical Datum of 1988 — the official reference frames for position and height throughout the United States and its territories — in 2022. NGS also solicited requirements, comments, and concerns from its stakeholders across the federal, public, and private sectors.
The Summit continued discussions from previous Geospatial Summits held in 2010, 2015, and 2017. An economic benefits study found that the NSRS — the consistent coordinate system that defines latitude, longitude, height, scale, gravity, orientation, and shoreline throughout the United States and its territories — will provide $522 million in annual estimated benefits to the nation once completed, with $240 million in annual estimated benefits resulting from improved floodplain management alone.
NGS Releases More Accurate GPS Coordinates
SUPPORTS NOS PRIORITY: SAFE AND EFFICIENT TRANSPORTATION AND COMMERCE
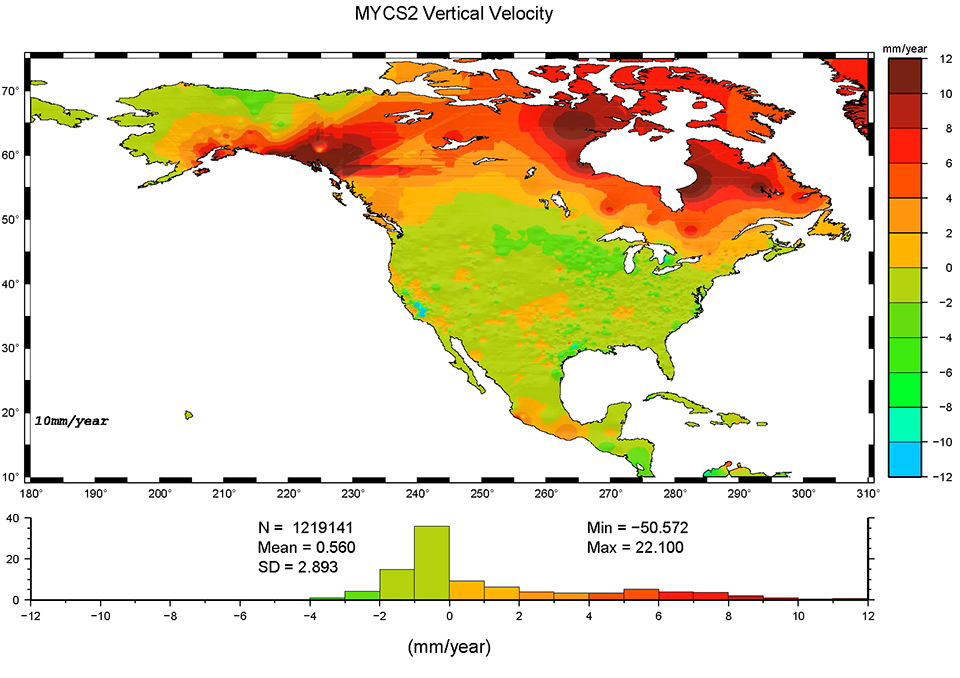
In 2019, NGS completed a major reprocessing of 22 years of data from 3,050 worldwide permanent GPS reference stations in order to improve precise positional coordinates at 2,000 NOAA Continuously Operating Reference Stations (CORS) across the United States and its territories. This effort, called the Multi-Year CORS Solution 2 (MYCS2), aligns the U.S. National Spatial Reference Frame to the newest International Terrestrial Reference Frame of 2014. The update provides improved accuracy and consistency in the U.S. framework for referencing high-accuracy positions for use by surveying, mapping, and geospatial professionals. Additionally, these more accurate coordinates were integrated into NGS’s popular Online Positioning User Service (OPUS) for direct use by the public and in many NGS data products.
The reprocessing campaign addressed many of the positional changes since the coordinates were last updated in 2011 including, but not limited to, those resulting from geophysical processes — earthquakes, subsidence, plate motion — and also from employing improved equipment and methods. The improved CORS coordinates will help surveyors, engineers, and other professionals obtain more accurate positions in numerous geospatial applications.
Screenshot from NOAA Continuously Operating Reference Station (CORS) showing vertical velocity changes identified from MYCS2.
NGS Releases Updated Strategic Plan
Cover of NGS Strategic Plan, 2019-2023.
SUPPORTS NOS PRIORITY: SAFE AND EFFICIENT TRANSPORTATION AND COMMERCE
NGS updated its strategic plan and accompanying research plan in 2019, helping to both guide NGS’s program direction from 2019–2023, and to aid NGS in re-establishing its priorities, manage its limited resources, and support its mission, which includes modernizing the National Spatial Reference System (NSRS) and assisting NSRS users. The Plan is organized around five goals: Support users of the NSRS; modernize and improve the NSRS; expand the NSRS Stakeholder Base through partnerships, education, and outreach; develop and enable a workforce in a supportive environment; and improve organizational and administrative functionality.
The NGS research plan identifies and prioritizes current and future research activities in support of the NSRS Modernization effort and NGS Strategic Plan 2019–2023.
NOAA and NIST Decide Fate of U.S. Survey Foot
SUPPORTS NOS PRIORITY: SAFE AND EFFICIENT TRANSPORTATION AND COMMERCE
Representatives from NGS, the National Institute of Standards and Technology’s (NIST) Office of Weights and Measures, and the Department of Commerce’s Office of the General Counsel have decided the fate of the U.S. survey foot after 2022. Since 1959, the United States has used two types of feet: the “international foot” and the “U.S. survey foot.” The two units of measurement differ by only 0.01 foot per mile, but having both in use has often resulted in confusion in surveying and mapping, where computing accurate coordinates over large distances are commonly required. That is why NIST and NOAA are retiring the U.S. survey foot.
The modernization of the National Spatial Reference System (NSRS) in 2022 is the perfect time to move the United States toward a single, uniform definition of the foot. Both NOAA and NIST have decided to deprecate the U.S. foot through two co-issued Federal Register Notices, and by conducting public outreach. NGS presented a public webinar illustrating the importance of using consistent measurement units, and NGS, in partnership with the COMET® Program, has developed a short video on this topic.
Participation in NGS Monthly Webinar Series Continues to Grow
SUPPORTS NOS PRIORITY: SAFE AND EFFICIENT TRANSPORTATION AND COMMERCE
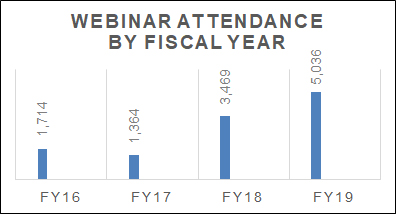
Chart showing NGS webinar attendance by fiscal year.
In 2019, NGS held 10 webinars with more than 5,000 total attendees, which is three times more attendees than NGS had in 2016 and 2017, and an approximately 50 percent increase over 2018. There are over 2,900 subscribers to announcements for upcoming NGS monthly webinars, and that number continues to grow. The NGS Webinar Series invites its personnel to present information of value to NGS constituents and stakeholders about NGS products, services, and program activities. The webinars educate constituents about NGS activities and provide opportunities for NGS to gather feedback from its customers. Webinars are generally held on the third Thursday of each month from 2:00-3:00 p.m., Eastern time. Registration is free, and there are currently over 70 video recordings of past webinars available for viewing.
Topics for the 2019 Webinar Series included the NGS Geoid Monitoring Services (GEMS), GPS on Bench Marks Campaign, Fate of the U.S. Survey Foot, State Plane Coordinate System Update, and Shoreline Mapping Data and Products.
NGS Captures Thousands of Images Assessing Damage of Dorian
SUPPORTS NOS PRIORITY: PREPAREDNESS AND RISK REDUCTION
From September 4–7, NGS coastal mapping and emergency response aircraft collected high-resolution digital imagery to assist federal, state, and coastal managers in assessing damage from Hurricane Dorian. As soon as conditions allowed, a team of NOAA aviators and sensor operators captured images from Fort Lauderdale, Florida, to Norfolk, Virginia, using specialized remote-sensing cameras. For this response effort, NGS collected more than 12,000 images covering 3,682 square miles. NGS collected this imagery to evaluate its mission to support safety of navigation at the request of the Federal Emergency Management Agency (FEMA) and other federal and state agencies.
At the request of the Bahamian National Emergency Management Agency, NGS captured high resolution imagery along the shoreline, ports, and impacted inland areas of the Bahamian Islands from September 17–20. This imagery was used by the National Emergency Management Association Emergency Support Function for further analysis, and was also used to determine geo-location of damage both on land and in the water, port approaches, and any obstructions to navigable commerce. Four flights provided 14,423 images and covered 1,728 miles.
Post-disaster aerial imagery provides timely, concise, and cost-effective information for emergency managers, so they may begin their assessments of damage to ports, waterways, coastlines, critical infrastructure, and coastal communities. FEMA used NOAA imagery to make well-informed decisions regarding appropriate federal assistance for populations affected by the storm. Collected images are available to view online through the NGS aerial imagery viewer.
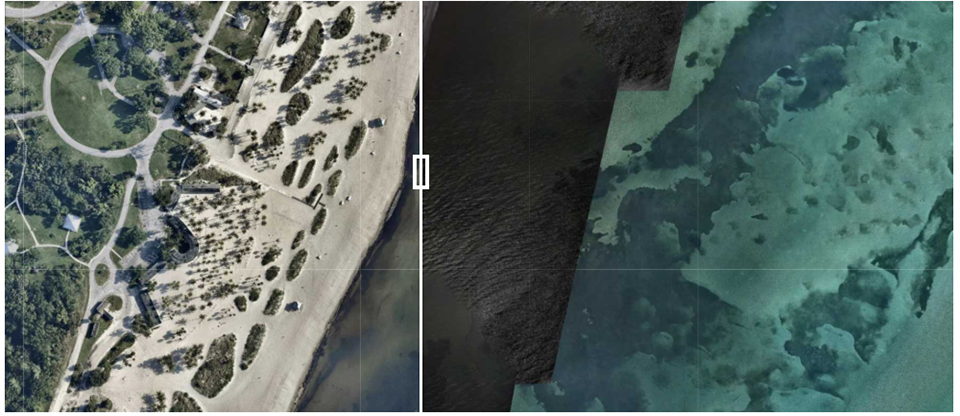
NOAA aerial imagery, before and after Hurricane Dorian: Key Biscayne, Florida, September, 2019.
NGS Aerial Imagery Helps Assess Damage After Hurricane Michael
SUPPORTS NOS PRIORITY: PREPAREDNESS AND RISK REDUCTION
From October 11–14, 2018, NGS collected 9,580 aerial damage assessment images covering approximately 4,153 square miles in the aftermath of Hurricane Michael. Imagery was collected in specific areas identified by NOAA in coordination with the Federal Emergency Management Agency (FEMA) and other state and federal partners. Collected images are available to view online via the NGS aerial imagery viewer. A team of NOAA aviators and sensor operators captured the images using specialized remote-sensing cameras aboard NOAA Office of Marine and Aviation Operations' King Air aircraft, flying above the area at an altitude of 5,500 feet.
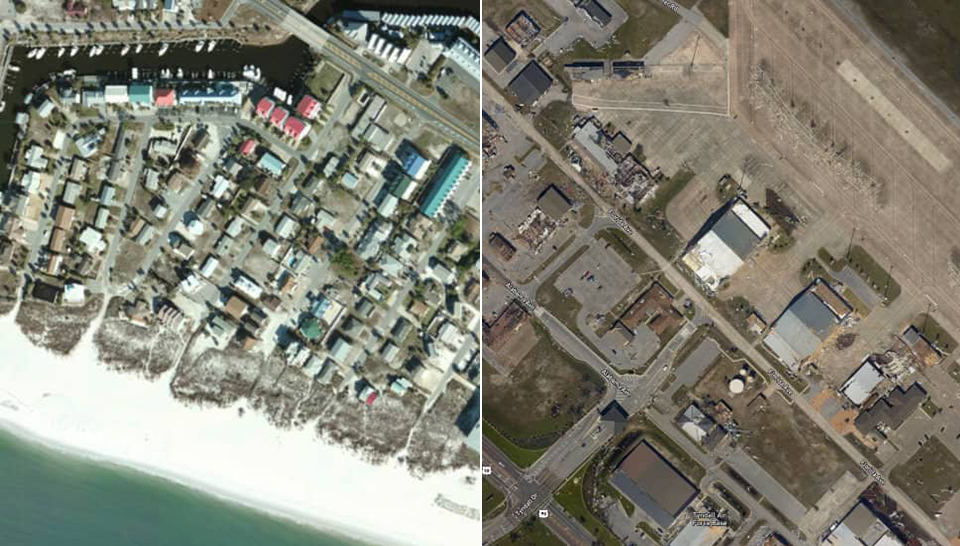
NOAA aerial imagery, before and after Hurricane Michael: Mexico Beach, Florida: October, 2018.
NGS Publishes Damage Assessment Imagery from Hurricane Barry
SUPPORTS NOS PRIORITY: PREPAREDNESS AND RISK REDUCTION
From July 16–17, 2019, NGS collected aerial damage assessment images in the aftermath of Hurricane Barry. NGS collected imagery in specific areas identified by NOAA in coordination with the Federal Emergency Management Agency (FEMA) and other state and federal partners. Collected images are available to view online through the NGS aerial imagery viewer. NOAA's aerial imagery aids safe navigation and captures damage to coastal areas caused by a storm. Aerial imagery is a crucial tool to determine the extent of the damage inflicted by flooding, and to compare baseline coastal areas to assess the damage to major ports and waterways, coastlines, critical infrastructure, and coastal communities. This imagery provides a cost-effective way to better understand the damage sustained to both property and the environment.
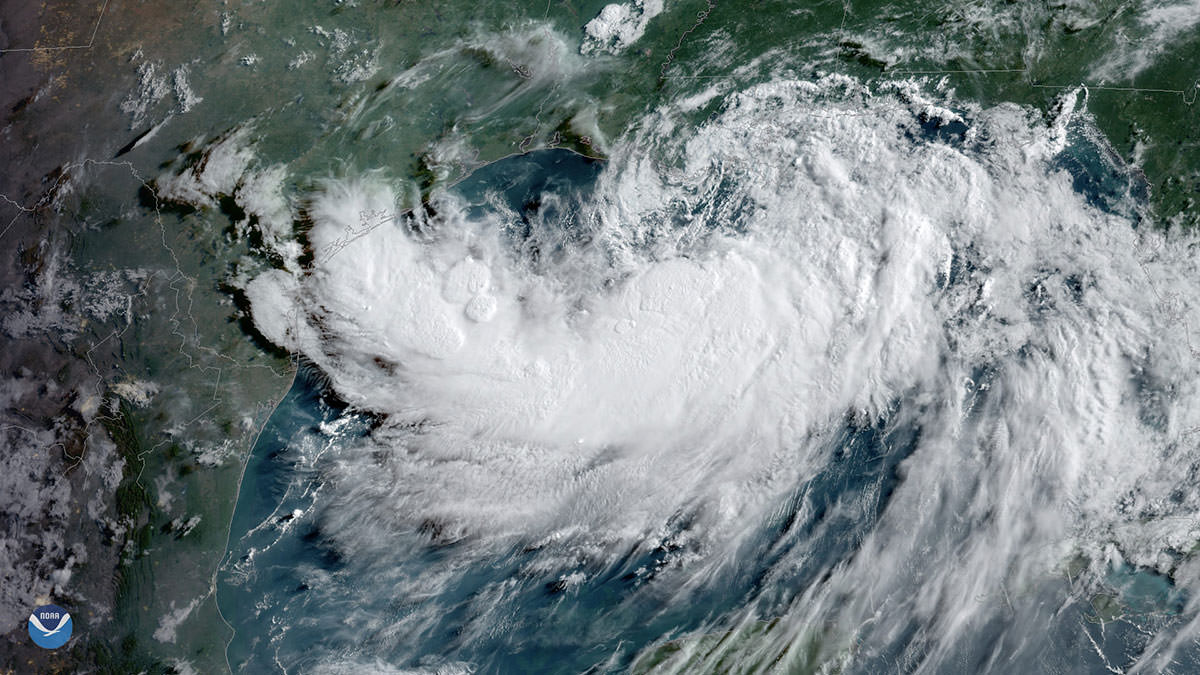
Tropical Storm Barry strengthens over the warm waters of the northern Gulf of Mexico prior to reaching hurricane strength: July, 2019.
 An official website of the United States government.