Center for Operational Oceanographic Products and Services
NOS Fiscal Year 2019 Year in Review
CO-OPS Creates New Web Tool to Help Coastal Communities
SUPPORTS NOS PRIORITY: PREPAREDNESS AND RISK REDUCTION
This image from the Coastal Inundation Dashboard shows that Vaca Key, Florida, was experiencing minor to moderate flooding September, 2019.
The Center for Operational Oceanographic Products and Services (CO-OPS) released the Coastal Inundation Dashboard, a new web tool that brings real-time, forecast, and historical water level information together in one place. This new tool allows coastal decision makers to understand both near-term inundation risks, such as impacts from an approaching hurricane or nor’easter, and longer-term risks, such as high tide flooding and sea level rise. The Dashboard uses data from a majority of the 200+ coastal water level stations operated by CO-OPS, as well as data available from NOAA partner water level stations, and other federal agency stations such as the U.S. Geological Survey.
New Forecast Models Aid Mariners
SUPPORTS NOS PRIORITY: SAFE AND EFFICIENT TRANSPORTATION AND COMMERCE
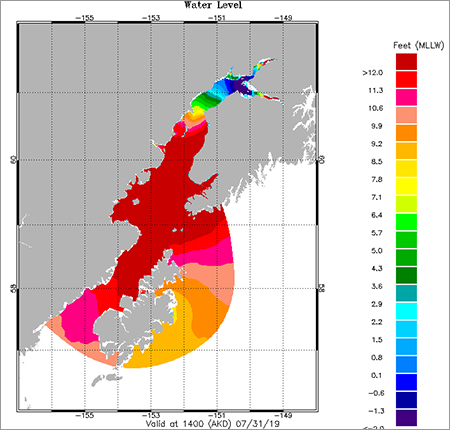
An example of water level forecast guidance for Cook Inlet, Alaska.
Two new oceanographic models are now operational in Lake Huron and Lake Michigan in the Great Lakes, and Cook Inlet in Alaska. CO-OPS developed the model for Lake Huron and Lake Michigan in partnership with the NOAA Great Lakes Environmental Research Laboratory, and combines two existing models into a single improved model. The model for Cook Inlet, Alaska, was developed in partnership with NOAA’s Office of Coast Survey. These models help mariners to navigate their local waters safely and more efficiently. Specifically, the models will provide operational nowcast and forecast guidance (out to 48 hours for Cook Inlet, and 120 hours for the Great Lakes) on parameters including water levels, water temperature, salinity, and currents. CO-OPS has implemented forecast systems like these in critical ports, harbors, estuaries, the Great Lakes, and coastal waters across the United States, forming a national backbone of real-time data, tidal predictions, data management, and operational modeling.
U.S. Ties Record for High Tide Flooding Days in 2018
SUPPORTS NOS PRIORITY: PREPAREDNESS AND RISK REDUCTION
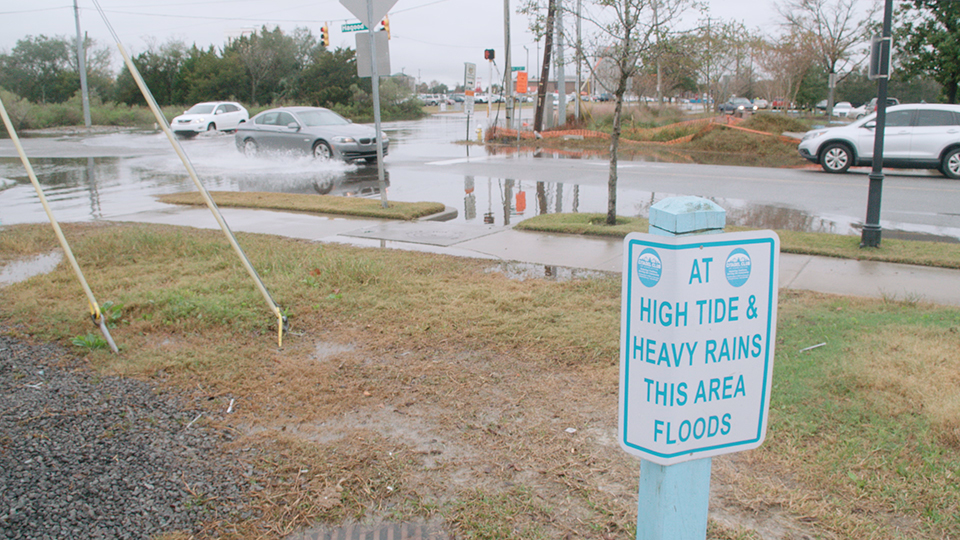
CO-OPS released its annual State of High Tide Flooding and 2019 Outlook report. The report shows that coastal communities across the U.S. continued to see increased high tide flooding in 2018, forcing their residents and visitors to contend with flooded shorelines, streets, and basements. High tide flooding, sometimes referred to as "nuisance" flooding, is coastal flooding that occurs at high tide when water levels measured at NOAA tide gauges exceed heights associated with minor impacts. High tide flooding is one of the most noticeable impacts of global sea level rise that we are experiencing today. Water reached the flooding threshold at NOAA tide gauges a record-breaking number of times in the Northeast and Gulf of Mexico due to a combination of active nor’easter and hurricane seasons combined with sea level rise. Twelve locations broke records. The elevated water levels affected coastal economies, tourism, crucial infrastructure (like septic systems), and stormwater systems. CO-OPS provides seasonal outlooks of when and where high tide flooding may occur through its High Tide Bulletins.
From May 2019 to April 2020, high tide flooding will occur about twice as often as levels typically observed in 2000. This image was taken in Charleston, South Carolina, during the December 14, 2016 "supermoon."
CO-OPS Provides Real-Time Data During Hurricane Dorian
SUPPORTS NOS PRIORITY: PREPAREDNESS AND RISK REDUCTION
CO-OPS monitored water levels and meteorological conditions in real-time for locations affected by Dorian through its online product, the Coastal Inundation Dashboard, and communicated real-time water level information through NOS social media platforms. During the storm, NOAA's Cape Hatteras, North Carolina tide station in Pamlico Sound and Oyster Inlet, South Carolina recorded their second highest water levels on record behind Hurricane Matthew at 5.35 feet and 3.47 feet above normal tide levels. High water was recorded at the Chesapeake Bay Bridge Tunnel, Virginia tide station at 3.61 feet above normal; Duck, North Carolina at 3.51 feet above normal; Sewells Point, Virginia at 3.11 feet above normal; and Fernandina Beach, Florida at 2.55 feet above normal tide levels.
 An official website of the United States government.

Social