
Students will revisit the initial Big Question: “How do Individuals, communities or governments ensure that there is enough seafood for people to eat in the future? ” Students will use their knowledge of food webs and trophic levels to address the Big Question. In this activity students will collect data about Spanish mackerel, a fish that is a major food source for other creatures in the Gulf of Mexico. After examining the trend in mackerel biomass, students will form a hypothesis about the biomass of a predator that feeds on mackerel, Bluefin tuna. Finally, students will compare biomass data for tuna with their hypothesis to see how knowledge about trophic levels can help answer the Big Question.
Inform students that they will use their knowledge of food webs and trophic levels to estimate the biomass of a type of fish that is an important source of food for people. Don’t tell the students yet that this food source fish is tuna. Explain that students will conduct a virtual dive in VES-V to gather biomass data about Spanish mackerel, which the “mystery fish” (tuna) feeds on. Based on the trend in biomass of mackerel, students will form a hypothesis about the biomass trend for the “mystery fish” (tuna).
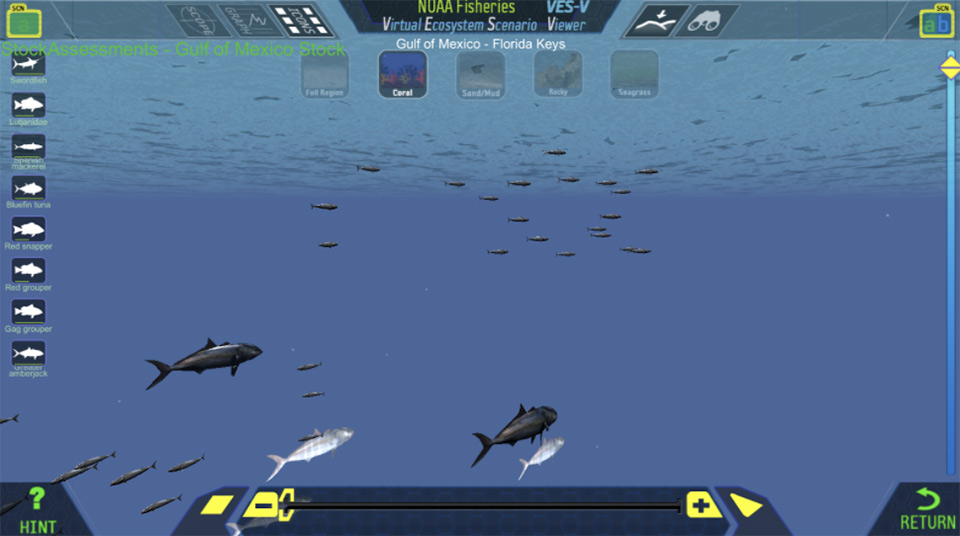
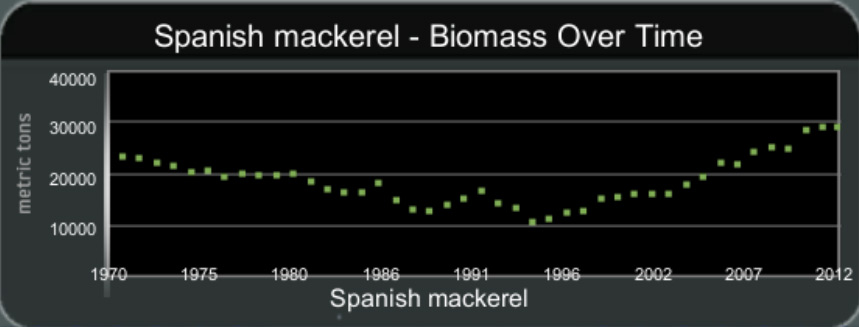
Have your students conduct a virtual dive in VES-V in the Gulf of Mexico. Direct them to the coral reef habitat in the Florida Keys (Figure 11). Have students load a different dataset in VES-V by clicking the green “SCN” (scenario) folder icon in the upper left. Have students switch to the StockAssessments scenario. Ask students to look at the graph of Spanish mackerel biomass (Figure 12), and to record the mackerel biomass values in 1995 and in 2012 on the table on “VES-V Ocean Food Webs Module Worksheet #6: Mackerel and Predator Biomass Data”.
Next, have students calculate the ratio of mackerel biomass in 2012 compared to the 1995 value by dividing the 2012 biomass by the 1995 biomass and record that ratio in the table on Worksheet #6.

Figure 11: Gulf of Mexico Region in VES-V with Stock Assessments Scenario

Figure 12: Spanish Mackerel Biomass in the Gulf of Mexico
Inform students that they will estimate the biomass of another species of fish that eats mackerel. The biomass of the predator species was around 15,000 tons in 1995. Have students record their estimates of the predator species biomass in 2012 in the “Predator, estimate” row of the table on Worksheet #6.
NOTE: Based on calculations in earlier sections of this lesson, students should realize that the biomass ratio for a “before” and “after” timeframe for a species can be about the same as the ratio for a predator of that species. For example, if herring biomass increases by 20%, it is reasonable to predict that the biomass of cod might also increase by 20%. If the biomass of sardines drops to half its current value, sea lion biomass might also decrease by half. In the current Gulf of Mexico case, mackerel biomass rose from around 10,000 tons to about 30,000 tons between 1995 and 2012. The biomass ratio for mackerel is therefore 3:1 ( = 30,000 / 10,000 ). It is reasonable to hypothesize, therefore, that the biomass of mackerel’s predator might also triple. Since the predator’s biomass was 15,000 tons in 1995, it is reasonable to predict that it tripled by 2012 to 45,000 tons. Students should work through this reasoning themselves and record their results in the “Predator, estimate” row of the table on Worksheet #6.
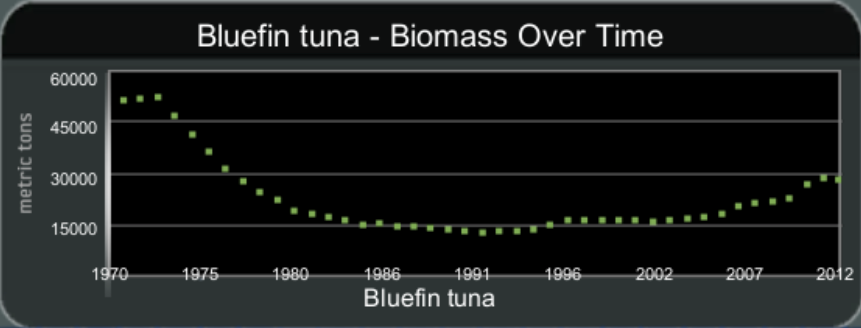
Ask students to test their hypothesis about predator biomass by analyzing actual data for predator biomass in 2012 from within VES-V. At this point, inform students that the predator species is Bluefin tuna. Have students observe the graph for Bluefin tuna (Figure 13) in VES-V, still using the Florida Keys coral reef habitat in the Gulf of Mexico with the StockAssessments scenario dataset.
Have students to record the tuna biomass in 2012 in the “Predator, data” row of the table on Worksheet #6. Students should also calculate the biomass ratio between 2012 and 1995 and record that in the table.

Figure 13: Bluefin Tuna Biomass in the Gulf of Mexico
NOTE: Table 7 shows appropriate student results for the “Mackerel and Predator Biomass Data” table on Worksheet #6. Desired student responses are shown in bold type. Since it is difficult to precisely determine some biomass values from the graph, the responses from your students will probably vary somewhat when compared to Table 7. Based on the sequence of instructions for this activity, students should gather data about mackerel and fill in the bottom row of Table 7 first. Whatever value near 3 they determine for the mackerel biomass ratio should be used in the “Predator, estimate” row for the ratio, which in turn determines the 2012 biomass value for that row. Finally, data read from the tuna graph in VES-V is used for the 2012 biomass in the “Predator, data” row, which in turn is used to calculate the actual tuna biomass ratio.
| 1995 biomass (metric tons) |
2012 biomass (metric tons) |
Biomass Ratio 2012/1995 |
|
|---|---|---|---|
| Predator, data | 15,000 | 30,000 | 2 |
| Predator, estimate | 15,000 | 45,000 | 3 |
| Mackerel | 10,000 | 30,000 | 3 |
Table 7: Mackerel and Tuna Biomass in the Gulf of Mexico
Discussion. Discuss these results with students. The estimated biomass for tuna (45,000 tons) is a bit higher than the actual value of 30,000 tons. However, the estimate is not way off. A poor estimate might have predicted a decrease in tuna biomass, or an increase by a factor of 10 or more. Instead, this estimate is reasonable, predicting a slightly high ratio of 3 instead of the actual value of 2, which is pretty close. Overall, this technique of using a prey’s biomass to predict the biomass of its predator seems reasonable, as long as we don’t expect it to be too precise.
NOTE: Your students might notice that although tuna are at a higher trophic level than mackerel, the biomass of each type of fish is roughly the same. This seems to violate the rule-of-thumb mentioned in Activity II that predicts a ratio of about 10:1 in biomass between one trophic level and the next higher level. Ask your students to speculate about this apparent discrepancy. An obvious explanation is that food webs are complex, and tuna probably have other food sources besides mackerel. Remind students that the 10:1 ratio in the trophic pyramid applies to all biomass in an ecosystem at different trophic levels, not just specific species such as tuna and mackerel.
Wrap up the lesson by revisiting the Big Question: “How do Individuals, communities or governments ensure that there is enough seafood for people to eat in the future? ”. Remind students that sometimes it might be difficult to directly count, or even estimate, the biomass of species that are important food sources for people, such as tuna and cod. In such cases, it might be possible to use data about the biomass of the food sources of the fish we are interested in to infer the likely biomass of those predators that people eat. It might be valuable therefore to count or estimate, by whatever means, the biomass of a species we are not directly interested in so we can have a better guess at the biomass of a species humans do care about for food, such as tuna and cod. Estimates based on this approach wouldn’t be precise, as Table 7 shows, but could be good enough to help refine counts made by other means. However, food webs are complex. Estimates of predator biomass based on the biomass of their prey could be way off if we don’t take into account various species that are part of a complex food web.