
Students will investigate the food web and trophic levels of a specific marine habitat in the Gulf of Maine. Using data gathered in VES-V, students will compare the biomass of a predator (Atlantic cod) with one of its prey (Atlantic herring). Based on this data, students will infer a relationship between the trophic level and biomass of a type of species in a food web.
Inform the students that they will use VES-V to gather data about two important species of fish in the Atlantic Ocean: cod and herring. Tell students to conduct a virtual dive in VES-V to the Northeast region, Gulf of Maine, sand flats habitat. They should use the default “Baseline” scenario dataset.
NOTE: There are two options to consider when facilitating this activity.
Have students construct a food web themselves for this habitat as was done in Activity III. If you used the default, Gulf of Maine habitat example in Activity III, you have already completed this step. If you chose a different habitat, more relevant to your students, for building the food web in Activity III, you will need a new food web diagram for the Gulf of Maine for this activity. Make sure at least one student or group researches each of the two key species in this activity: cod and herring.
Have students view a pre-existing food web diagram for the Gulf of Maine habitat. This option requires less time. Figure 5 shows a partial food web diagram for the Gulf of Maine habitat.

Figure 5: Food Web Diagram for the Gulf of Maine Habitat
Discussion. What are the relative positions of herring and cod within this food web? Note what herring eat, and what preys on them. Likewise, notice cod’s food sources and predators. Have students describe the trophic levels of herring and cod.
Explore the food sources and predators of herring and cod in a bit more depth. Either show Table 2 to students, or have them conduct research to gather similar information themselves.
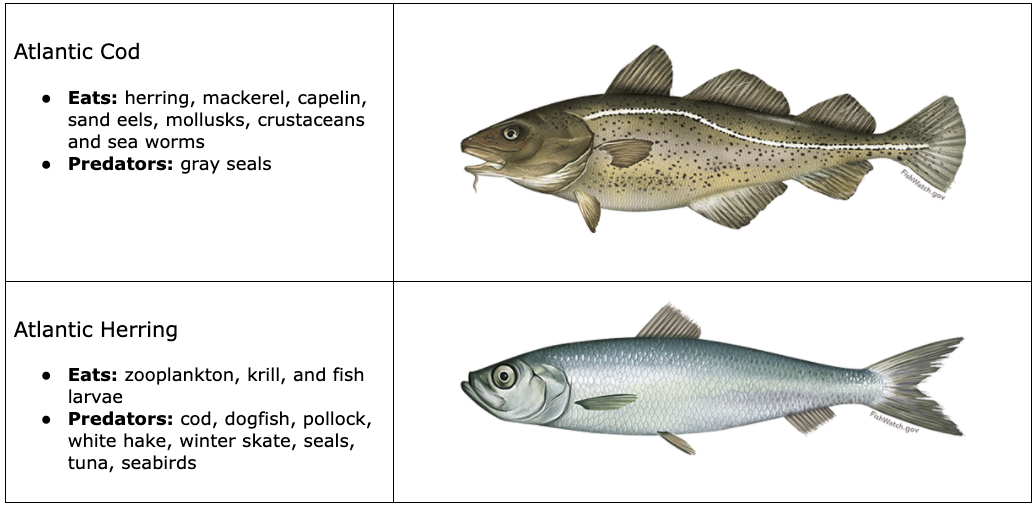
Table 2: Food Sources and Predators of Cod and Herring
Instruct students to conduct a virtual dive in VES-V to the Northeast region, Gulf of Maine, sand flats habitat, using the default “Baseline” scenario dataset. If you choose to have students create a food web diagram themselves, they may need to “dive” twice: once to set up the food web diagram, then a second time to gather biomass data.
Collecting Biomass Data: To collect biomass data, students should first click on the cod icon along the sides of the screen once they are in the Gulf of Maine sand flats habitat in VES-V. Clicking the cod icon will reveal the biomass graph for cod. Have students record the cod biomass in the year 2023 in the table on “VES-V Ocean Food Webs Module Worksheet #2: Gulf of Maine: Cod & Herring Biomass Data”. We suggest using data from 2023 for two reasons. That year is labeled on the graph’s x-axis, making it easier to locate. Also, although the cod biomass remains pretty steady over time after about 1970, the herring population fluctuates substantially. The value in 2023 is reasonably representative of the average value across the graph.
After students record cod biomass data, have them use the same process to record biomass data for herring in 2023. Note that due to the fluctuations in the herring biomass graph over time, any value between about 550,000 and 700,000 tons is reasonable.
Have the students calculate the biomass ratio and record that value on Worksheet #2.
Herring Biomass ÷ Cod Biomass = Biomass Ratio
Ask students to use their knowledge of the food web for this environment to record the trophic level for cod and herring in the table. We suggest they use relative values for trophic level (such as “high”, “low”, or “highest”), but you can have students use numerical values instead if you wish. Table 3 below shows the Worksheet #2 table with desired student responses. Note that any description of trophic levels that lists cod at a higher trophic level than herring is acceptable.
| Species | Biomass (metric tons) | Trophic Level |
|---|---|---|
| Atlantic Cod | 70,000 | high |
| Atlantic Herring | 700,000 | low |
Table 3: Cod and Herring Biomass and Trophic Levels
Ask students to formulate a hypothesis about the relationship between biomass and trophic level. Students should realize that a population with a higher trophic level generally has less biomass than a population with lower trophic level.
NOTE: The ratio of herring biomass to cod biomass is approximately 10 to 1. This aligns well with the typical 10:1 biomass ratio in the trophic pyramid, described in Activity II Worksheet #2. The large difference between cod and herring biomass might not be readily apparent to some students based on viewing numbers in a table.
Extension: As an option, you can have students graph the cod and herring biomass numbers to provide a visual representation (and develop some skill with Google Sheets/Microsoft Excel/or similar software). Figure 6 shows two options for a graph, using a bar chart or a pie chart. This optional aspect of the activity provides students with practice making graphs: deciding which type of graph to use, determining appropriate scale, and possibly using a spreadsheet or other software.

Figure 6: Bar Graph and Pie Chart Illustrating Cod and Herring Biomass