
This activity is similar to Activity IV but adds more species and complexity to the system examined. Students will investigate the food web and trophic levels of another marine habitat, collect biomass data for multiple species in a kelp forest habitat in Monterey Bay, CA and compare the biomass data for species at different trophic levels. The key species in this activity are sardines, California sea lions, orcas (killer whales) and blue whales. This activity reinforces the concept that trophic level and biomass are usually inversely related; there is generally more biomass at lower trophic levels, and less biomass at higher trophic levels.
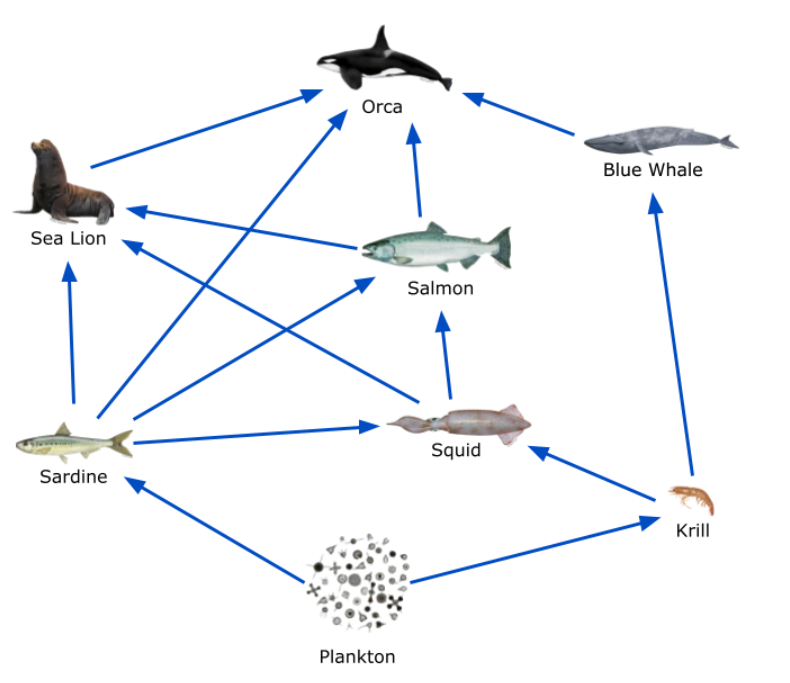
As in Activity IV, you can choose to have students create a food web diagram for this habitat, or you can use a pre-existing food web diagram during initial discussions about this activity. If you choose to have students construct the food web diagram themselves, as was done in Activity III, make sure that they include sardines, sea lions, orcas and blue whales in their diagram. Figure 7 shows a typical, partial food web diagram for the Monterey Bay kelp forests.

Figure 7: Food Web Diagram for the Monterey Bay Habitat
Discussion: Have a conversation about this food web with students. In the conversation be sure to note the relative trophic levels of the four species that are the focus of this activity: sardines, sea lions, orcas and blue whales. Compare the sizes of individual specimens of sardines, sea lions, orcas and blue whales. Sardines are much smaller than the sea lions that eat them, and the orcas that eat sea lions are larger still. Note how blue whales are the largest creatures in this food web, but are relatively low in terms of trophic level.
Have students formulate a hypothesis about the relative biomass for the sardines, sea lions, orcas and blue whales. Tell students to place these four species onto the “VES-V Ocean Food Webs Module Worksheet #3: Hypothesis: Biomass in Monterey Bay” page in their student worksheets.
Discussion: Based on their hypothesis about the relative biomass of each species, ask students to speculate about the role of individual size versus trophic level in terms of biomass. Do they think orcas (high trophic level) or blue whales (largest individual species size) will have a greater biomass?
NOTE: By now, students should realize that the low trophic level of sardines means that they would be expected to have a high biomass. The biomass of sea lions figures to be intermediate, and the high trophic level of orcas would lead one to expect them to have lower biomass. The blue whale presents a bit of a puzzle. Its trophic level is fairly low, so it is reasonable to expect that the biomass of blue whales might be fairly high. However, the sizes of blue whales, which are larger than even orcas, might lead some students to guess that they have low biomass. Students don’t actually have enough data to accurately estimate the blue whale biomass.
Ask students to conduct another virtual dive in VES-V, this time along the West Coast region in Monterey Bay. Have students select the kelp forest habitat, and to use the “Baseline” scenario dataset which loads by default.
Instruct students to click on the icons, along the left and right edges of the screen, for each of the four species studied in this activity (sardines, sea lions, orcas and blue whales) and have them record the biomass for each of the four species, as shown on the biomass graphs, in the year 2044.
NOTE:The year 2044 was chosen because it is easy to locate since it is labeled on the x-axis of the graph, and because the biomass value in that year is reasonably representative of the average biomass across the timespan of the graph for each of the species.
Have students complete “VES-V Ocean Food Webs Module Worksheet #4: Monterey Bay Biomass Data” by recording biomass data in the table, indicating the relative trophic levels for each of the four species on the table, using relative values like “highest”, “low”, “medium”, and so on and calculating the ratios between the biomass of sardines and the biomass of sea lions that prey on them, and the biomass of sea lions and the biomass of orcas that prey on them.
NOTE: Do not have students write anything for predator/prey ratio in the orca and blue whale rows. Orcas are apex predators, so there is no orca predator to make a ratio from. Similarly, although orcas have been observed eating blue whales, the whales are not a significant part of an orca’s regular diet, so we advise leaving them off of this table.
Table 4 shows the expected results for the student data tables. Note that student responses will vary somewhat. The biomass values from the graphs may be slightly higher or lower, since it is difficult to determine exact values from the graphs. The ratios are based on the biomass values, so those may also vary a bit.
Student responses for the relative trophic levels are acceptable as long as sardines are lower than sea lions, sea lions are lower than orcas, and blue whales are somewhere in the low to medium range.
| Species | Biomass (in 2044) metric tons | Predator/Prey Biomass Ratio |
Trophic Level |
|---|---|---|---|
| Blue Whale | 2,200,000 | NA | low |
| Orca | 1,000 | No predator | highest |
| California Sea Lion | 70,000 | l70:1 (Sea Lion:Orca) | high |
| Sardine | 1,000,000 | 14:1 (Sardine:Sea Lion) | low |
Table 4: Expected Student Responses for Monterey Bay Biomass Values
Extension
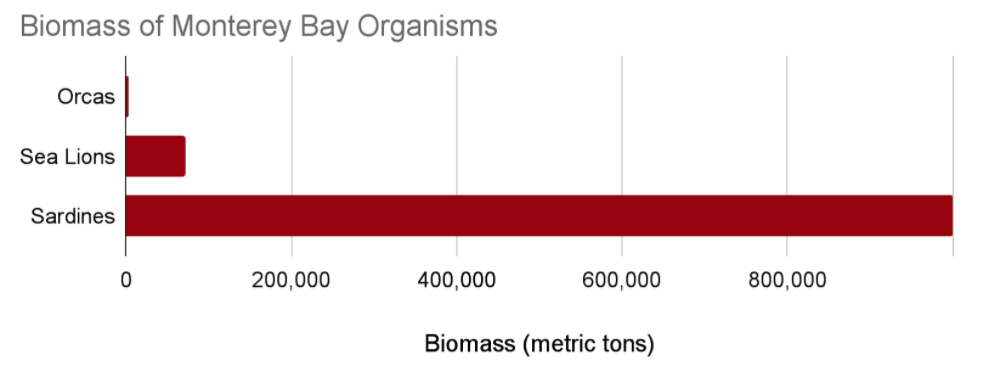
Once again, you may want to have students graph these results to gain a better sense of the relative scales of these biomass numbers. Figure 8 shows a sample bar graph for orcas, sea lions, and sardines that dramatically illustrates the differences in biomass.

Figure 8: Bar Graph Comparing Biomass of Sardines, Sea Lions and Orcas
Discussion. Have a conversation about these results with students. Note that once again the sardines, near the bottom of the trophic pyramid, have a much greater biomass than sea lions, which in turn have greater biomass than orcas. Note that although individual orcas and blue whales are both very large, the total biomass of orcas is fairly low. Orcas have a much higher trophic level than blue whales. Guide students to understand that trophic level, not the size of individual creatures, is the dominant factor driving total biomass of a species. Remind students of the rule of thumb that biomass often increases by a factor of ten or so with each step down the trophic pyramid. In the Monterey Bay ecosystem data, this trend is even more pronounced. Sardine biomass is around 14 (close to 10!) times as great as sea lion biomass. Sea lion biomass is about 70 times orca biomass.
Discussion. Discuss with students some of the limitations of this approach to studying biomass and trophic levels. The rule of thumb 10:1 ratio in biomass between trophic levels refers to all biomass at a given trophic level in an ecosystem, not just a specific species.
NOTE: Lots of different creatures eat sardines. Sea lions eat a variety of creatures as well as sardines. Some of your students may have discovered, while conducting research about the marine species in this activity, that some local populations of orcas feed exclusively on a specific type of species, such as salmon. Other orcas are generalists and eat a variety of species. Because of these complications, one should not expect the 10:1 ratio to strictly apply to specific species. However, as shown in both the Gulf of Maine and the Monterey Bay examples, biomass does tend to be higher for creatures with lower trophic levels. That relationship is the key take-home message for these two case studies.