
Students will use their knowledge of biomass ratios of species at different trophic levels to predict the new biomass of a species when the biomass of its prey changes. Students will discuss the complex relationships in food webs, and how that complexity affects the ability to predict the outcomes of changes in a food web.
Discussion. Discuss with students how some types of marine species are more difficult to count than others. Have students brainstorm some possible reasons for this. Responses might include: some fish are faster than others and might evade sampling nets, some small fish might slip through gaps in nets, some creatures have good camouflage that makes it harder to notice them, and so on. Sometimes it is possible to estimate the population size and biomass of one species that is difficult to count by counting a species it feeds on and using knowledge of ratios of creatures at different trophic levels. Inform students that in this activity they will estimate the biomass of a predator based on the biomass of its prey.
Direct students to “VES-V Ocean Food Webs Module Worksheet #5: Predator and Prey Biomass Relationships”. The first table on Worksheet #5 revisits the cod and herring case study from Activity IV. Have students consider that the herring biomass increased from 700,000 tons to 800,000 tons. If the starting biomass of cod was 70,000 tons, what is the expected new biomass of cod based on the increase in herring? Ask students to estimate the new cod biomass and record their estimate in the worksheet table.
NOTE: Students should realize that the cod biomass is likely to increase, since the biomass of one of cod’s food sources (herring) increased. If students expect cod biomass to decrease instead, ask them to explain their reasoning. Students should also understand that the ratio of cod to herring is likely to remain about the same, because of the position of each fish in the trophic pyramid. The starting ratio is 10:1, since there are 700,000 tons of herring compared to 70,000 tons of cod. To maintain this 10:1 ratio after the herring biomass increases to 800,000 tons, the cod biomass should rise to about 80,000 tons. Table 5 shows expected student results for this estimate; the new cod biomass of 80,000 tons that students should record on Worksheet #5 is shown in bold type. Some students might mistakenly estimate that the cod biomass would rise as much herring biomass, increasing by 100,000 tons from 70,000 to 170,000 tons. If so, discuss with students how the comparison between cod and herring biomass is based on a ratio.

Direct students to the second table on “VES-V Ocean Food Webs Module Worksheet #5: Predator and Prey Biomass Relationships”. This table revisits the orca, sea lion, and sardine case study from Activity V. Ask students to create a model that describes the condition in which the sardine biomass drops from 1,000,000 tons to 500,000 tons. Have students record their modeled estimates for new biomass values for sea lions and orcas onto Worksheet #5.
NOTE: The starting value for sea lion biomass is 70,000 tons, while the orca biomass starts at 1,000 tons. Table 6 shows expected student results. Since sardine biomass was cut in half, it is reasonable to expect that the biomass of its predator (sea lions) might also drop by 50%, and that the biomass of sea lions’ predator (orcas) might also be cut in half. Once again, if students have the misconception that the sea lion and/or orca biomass would be likely to increase, discuss their reasoning with students. If student responses don’t maintain the ratios between creatures at different trophic levels, remind students of that relationship. Table 6 shows expected student responses, with the values determined by students shown in bold type.

Table 6: Estimate of Orca and Sea Lion Biomass Based on Sardine Biomass
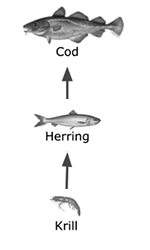
Figure 9: Simple Food Chain
Discussion. Wrap up this activity with a discussion of the complexity of using these concepts with an actual food web. Figure 9 shows a very simple food chain that includes krill, herring and cod. In a simple system like this, it is easy to see how a change in the herring biomass would be very likely to cause a roughly proportional change in the cod biomass. Figure 10 shows a slightly more complex food web diagram that represents a portion of the food web in the Gulf of Maine habitat that was explored earlier in this lesson. In that case, the overall effect on the whole food web caused by a change in the herring biomass is not as straightforward to predict. If herring biomass decreases, it seems likely that cod biomass would decrease as well. Since tuna also eat herring, the biomass of tuna might also decline. However, tuna might instead switch to feeding primarily on mackerel, which might cause changes to the mackerel population. Likewise, an increase in the herring biomass could cause tuna to prefer the more readily available herring over mackerel in their diet. If fewer mackerel were eaten by tuna, the mackerel population might increase. More mackerel would probably eat more krill, which could decrease the food supply for herring. Real food webs often have complex relationships like this, so a change in the population of one species can ripple through the rest of the web, causing other changes that are difficult to predict.
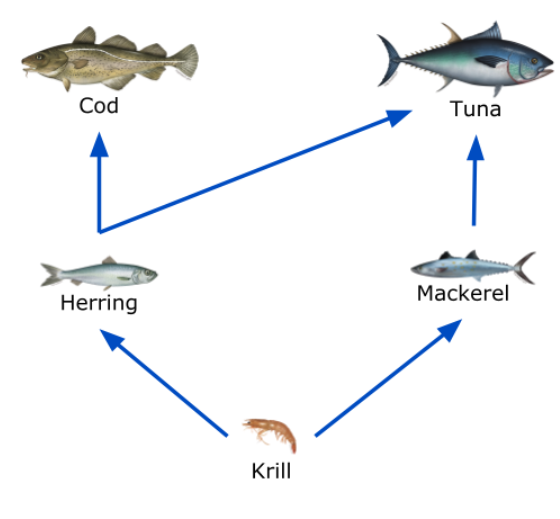
Figure 10: A Slightly More Complex Partial Food Web