
Students will build a food web diagram for a marine ecosystem as a whole-class jigsaw activity. Individuals or small groups of students will conduct research about a specific fish or other species, determining what it eats and what preys on it. Students will combine their data to create a food web diagram that incorporates each of the individually researched species.
Share with the students the region and habitat they will build a food web diagram for. This activity uses the sand flats in the Gulf of Maine off the Atlantic Coast of New England as an example to explain the process. You may choose a different habitat if that is more relevant to your students, as described in Activity I.
Have students conduct another virtual dive in VES-V to the sand flats in the Gulf of Maine in the Northeast region (or whichever other habitat you’ve chosen). The icons along the left edge and the right edge of the screen in VES-V display the species from that habitat that are present in the VES-V simulation. Students should choose a species from the ones present to research. The students will do their research outside of the VES-V software.
NOTE: It is important that students or groups pick enough different species to build a food web. You may need a system that takes a species out of consideration for other groups once one group has chosen it, to make sure students choose to research different creatures. If you are using the default habitat in the Gulf of Maine, make sure at least one group chooses Atlantic cod and another selects Atlantic herring to research; these species will be featured in Activity IV.
Investigation: Have students conduct a brief investigation on the Internet about the selected species. The investigation should determine what it eats, what preys on it, the creature’s size, and any other key pieces of information about it, such as whether humans make use of it and how.
NOTE: Suggested Resources: NOAA’s “Find a Species:” (www.fisheries.noaa.gov/find-species) This web site is a good source of information about marine species. However, your students may need to look on other sites as well to find all the information they need about their species.
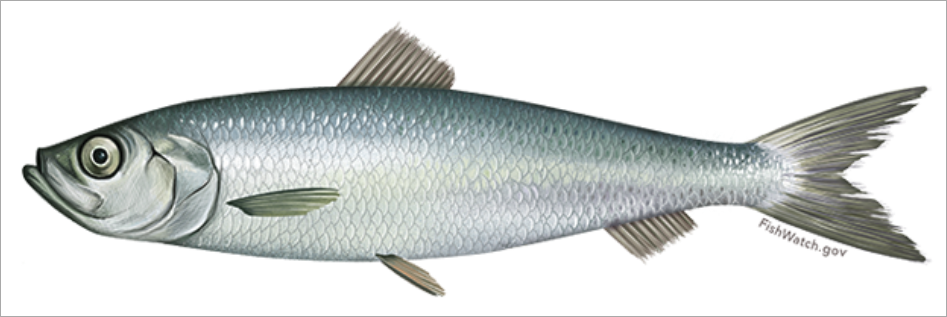
Ask students or student teams to complete the “VES-V Ocean Food Webs Module Worksheet #1: Research an Organism.” This worksheet provides a template for your students to record their findings. Table 1 shows an example of desired student notes about Atlantic herring.

Atlantic Herring
| Organism | Atlantic Herring |
| Size | Up to 2.4 pounds and 14-18 inches long |
| What it eats | Zooplankton, krill, fish larvae |
| Predators | Cod, dogfish, pollock, white hake, winter skate, seals, tuna, seabirds |
| Interesting Information | Humans eat herring and use it as bait. Herring is a major food source for many North Atlantic species. Herring swim in large schools. |
Table 1: Example of Desired Student Research Notes for Atlantic Herring

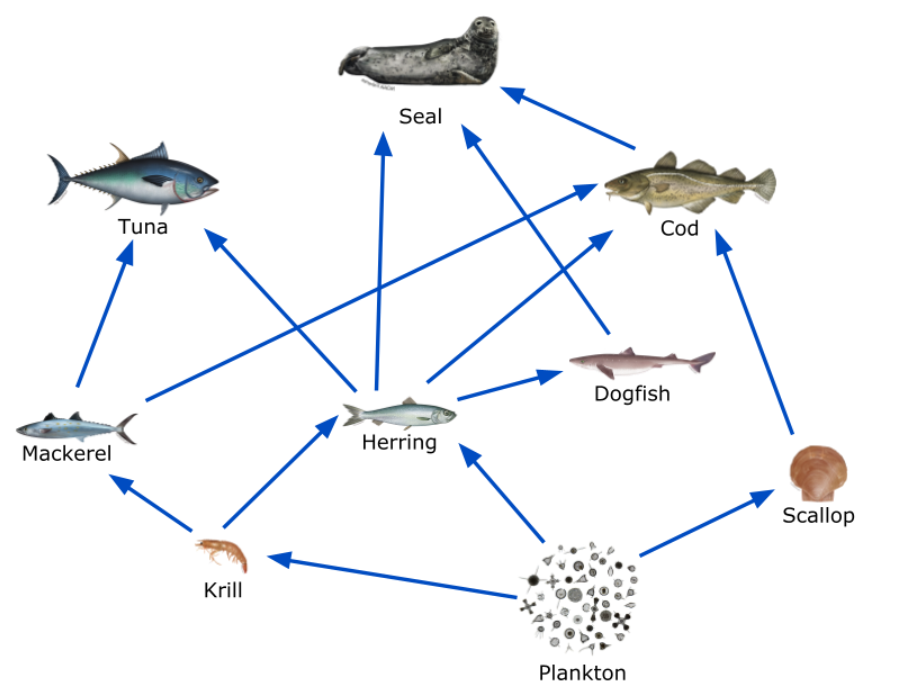
Figure 3: Partial Food Web Diagram for the Gulf of Maine Habitat
NOTE: The details of the food web diagram your students produce will be different from this figure, depending on which habitat and species your class includes.
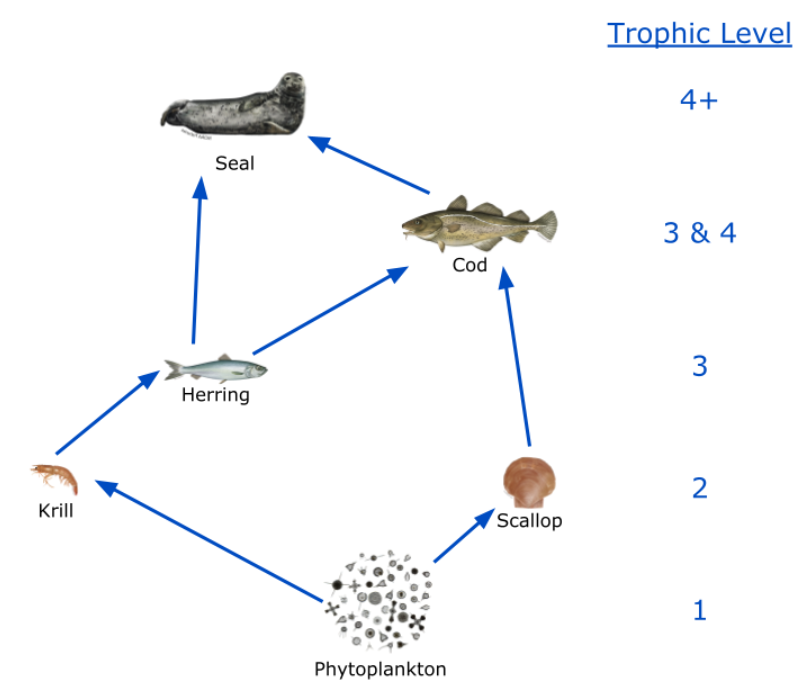
Discussion: Using the food web your class just created, discuss trophic levels with students. Identify the trophic levels of some of the species in your food web diagram. Figure 4 shows the trophic levels of a few of the species from the food web diagram in Figure draws students’ attention to the trophic levels of species that eat creatures at more than one trophic level. It may be helpful to point out that sometimes it is more important to notice the relative trophic level, whether a creature is at a higher or lower trophic level than another, than to determine the exact numerical trophic level.
Have students formulate a hypothesis about the relationship between trophic level and the number of organisms in a population. Remind them of the trophic pyramid.

Figure 4: Trophic Levels for Some Organisms in the Food Web
NOTE: Cod are at trophic level 3 (because they eat scallops, at trophic level 2) and level 4 (because they eat herring, at trophic level 3). Many creatures, especially in marine environments, occupy more than one trophic level.