
Three closely-related concepts are used throughout this lesson: food webs, trophic levels, and biomass. This activity provides a brief introduction to key aspects from these concepts that are used throughout this lesson. If your students are familiar with these ideas, we suggest you review them in the context of marine ecosystems.
Via lecture/short presentation introduce the students to the following concepts and terms below. We recommend you use the presentation graphics with the images noted below to illustrate the concepts being discussed:
A simplistic food chain links biological producers and consumers in a linear sequence of what-eats-what. Producers, plants or other autotrophs, create their own food, typically using sunlight to power photosynthesis. Primary consumers eat producers. Examples include deer grazing on grass or shrimp feeding on algae. Secondary consumers eat primary consumers. A snake eating a rabbit is an example of a secondary consumer. Tertiary consumers eat secondary consumers. A hawk eating the rabbit-eating snake from the previous example illustrates a tertiary consumer.

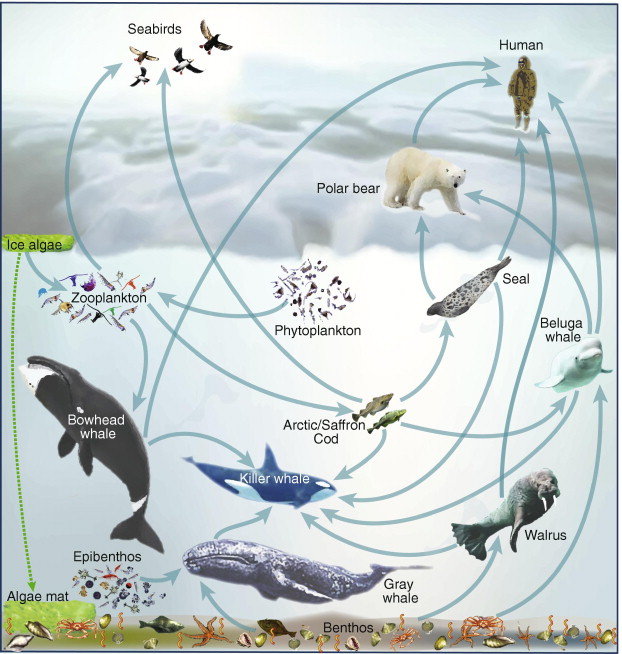
Figure 1: Food Web Diagram (Credit: Moore. S. and P. Stabeno. 2015. Synthesis of Arctic Research (SOAR) in Marine Ecosystems of the Pacific Arctic. License: Creative Commons Attribution-NonCommercial-NoDerivatives 4.0 International)
Ecosystems have much more complex what-eats-what relationships than a simple food chain. Most species dine on a variety of food sources, and are in turn preyed upon by multiple other creatures. Food web diagrams, such as Figure 1, depict these complex feeding relationships. By convention, arrows point from the prey to the predator, which is also the direction of energy flow in the feeding process. Food webs can reveal that the distinction between primary, secondary, and tertiary consumers isn’t always clear-cut. For example, shrimp that eat both phytoplankton (producers) and zooplankton (primary consumers) are both primary and secondary consumers.
The term trophic level describes the distance along the producer-consumer chain that a specific species occupies. Producers have a trophic level of 1, primary consumers 2, secondary consumers 3, and tertiary consumers 4. Some ecosystems include apex predators that eat tertiary consumers, and are thus trophic level 5.

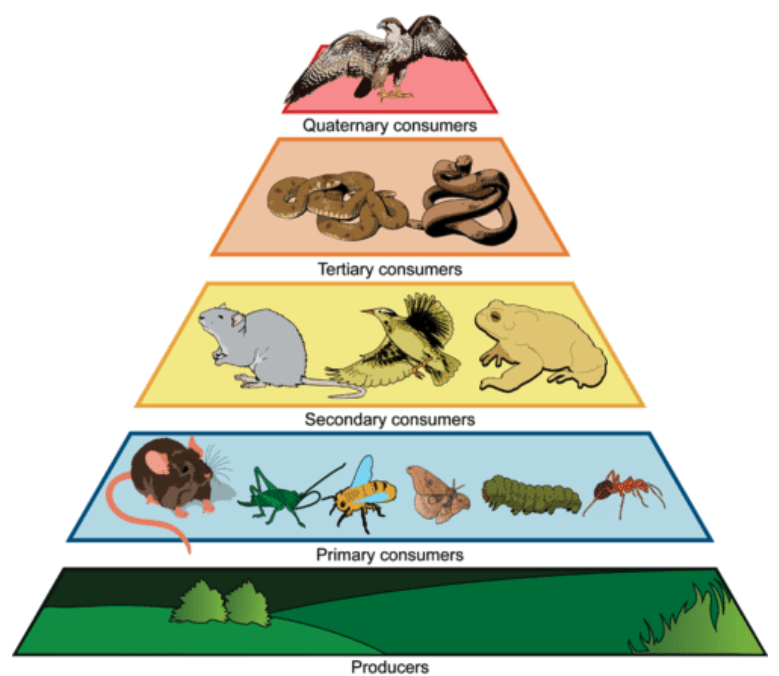
Figure 2: Trophic Pyramid, with Higher Trophic Levels Towards the Top (Credit: Mariana Ruiz Villarreal for CK-12 Foundation. License: CC BY-NC 3.0)
A trophic pyramid (Figure 2) is a diagram that shows trophic levels of creatures and indicates where the energy and biomass in an ecosystem is found. When one creature eats another, the process is less than 100% efficient; some energy is lost. Because of this, each step up the trophic pyramid involves the loss of some useful chemical energy from the ecosystem. That is why the diagram is pyramid-shaped; the wide base indicates that most of the energy (and biomass) in the ecosystem is found at lower trophic levels, while the narrow top shows that little energy (and biomass) is found in the top predators.
NOTE: A general rule that applies to many ecosystems states that the next lower level in a trophic pyramid usually has about 10 times the energy and biomass as the level above it.
Biomass is the total amount of mass of living creatures of a given type or in a certain area. For example, one could describe the total biomass of fish in a cubic kilometer of ocean, or the biomass of all jellyfish. Biomass equals the total number of organisms of a species multiplied by the average mass of a single creature of that species.
NOTE: Biomass = (# of organisms of species X) * (average mass of a single organism of species X)
A single, large adult fish contributes more to biomass than a small, juvenile fish does. However, as noted in the trophic pyramid section above, there may be more smaller fish than larger ones, so the many small fish might contribute more to total biomass than a few larger fish do. For example, a large school of sardines might outweigh a single whale.