

In this activity students will conduct a “virtual dive” using the VES-V simulation software to become familiar with its features and to generate student interest in using it. VES-V will be used to support activities throughout this module.
Explain to students that VES-V is a data visualization tool that uses virtual reality (VR) to display simulations of underwater environments in the ocean, complete with fish and other aquatic life. Using VES-V is like taking a virtual SCUBA dive at one of several places in the oceans. VES-V uses actual data, either from observations or from a model, to determine how many and what types of fish to show in each habitat. Students will use VES-V in this module to learn about food webs, trophic level, and the relationships between populations of species that eat each other.
NOTE: In later activities, students will build a food web diagram of marine species from one of the habitats represented in VES-V. This activity uses one specific habitat in VES-V as an example setting for that food web: sand flats in the Gulf of Maine off the Atlantic Coast of New England. However, if you and your students live nearer another region represented in VES-V that would be more relevant to the students, feel free to build a food web based on that region instead. Likewise, if another activity in your curriculum emphasizes a certain region(s), feel free to use those familiar locales as the basis of the food web jigsaw activity. In either case, tell students to conduct an initial, exploratory “virtual dive” to the habitat they will study later, either the Gulf of Maine habitat that we use as an example here, or whichever other habitat is more relevant to your students.
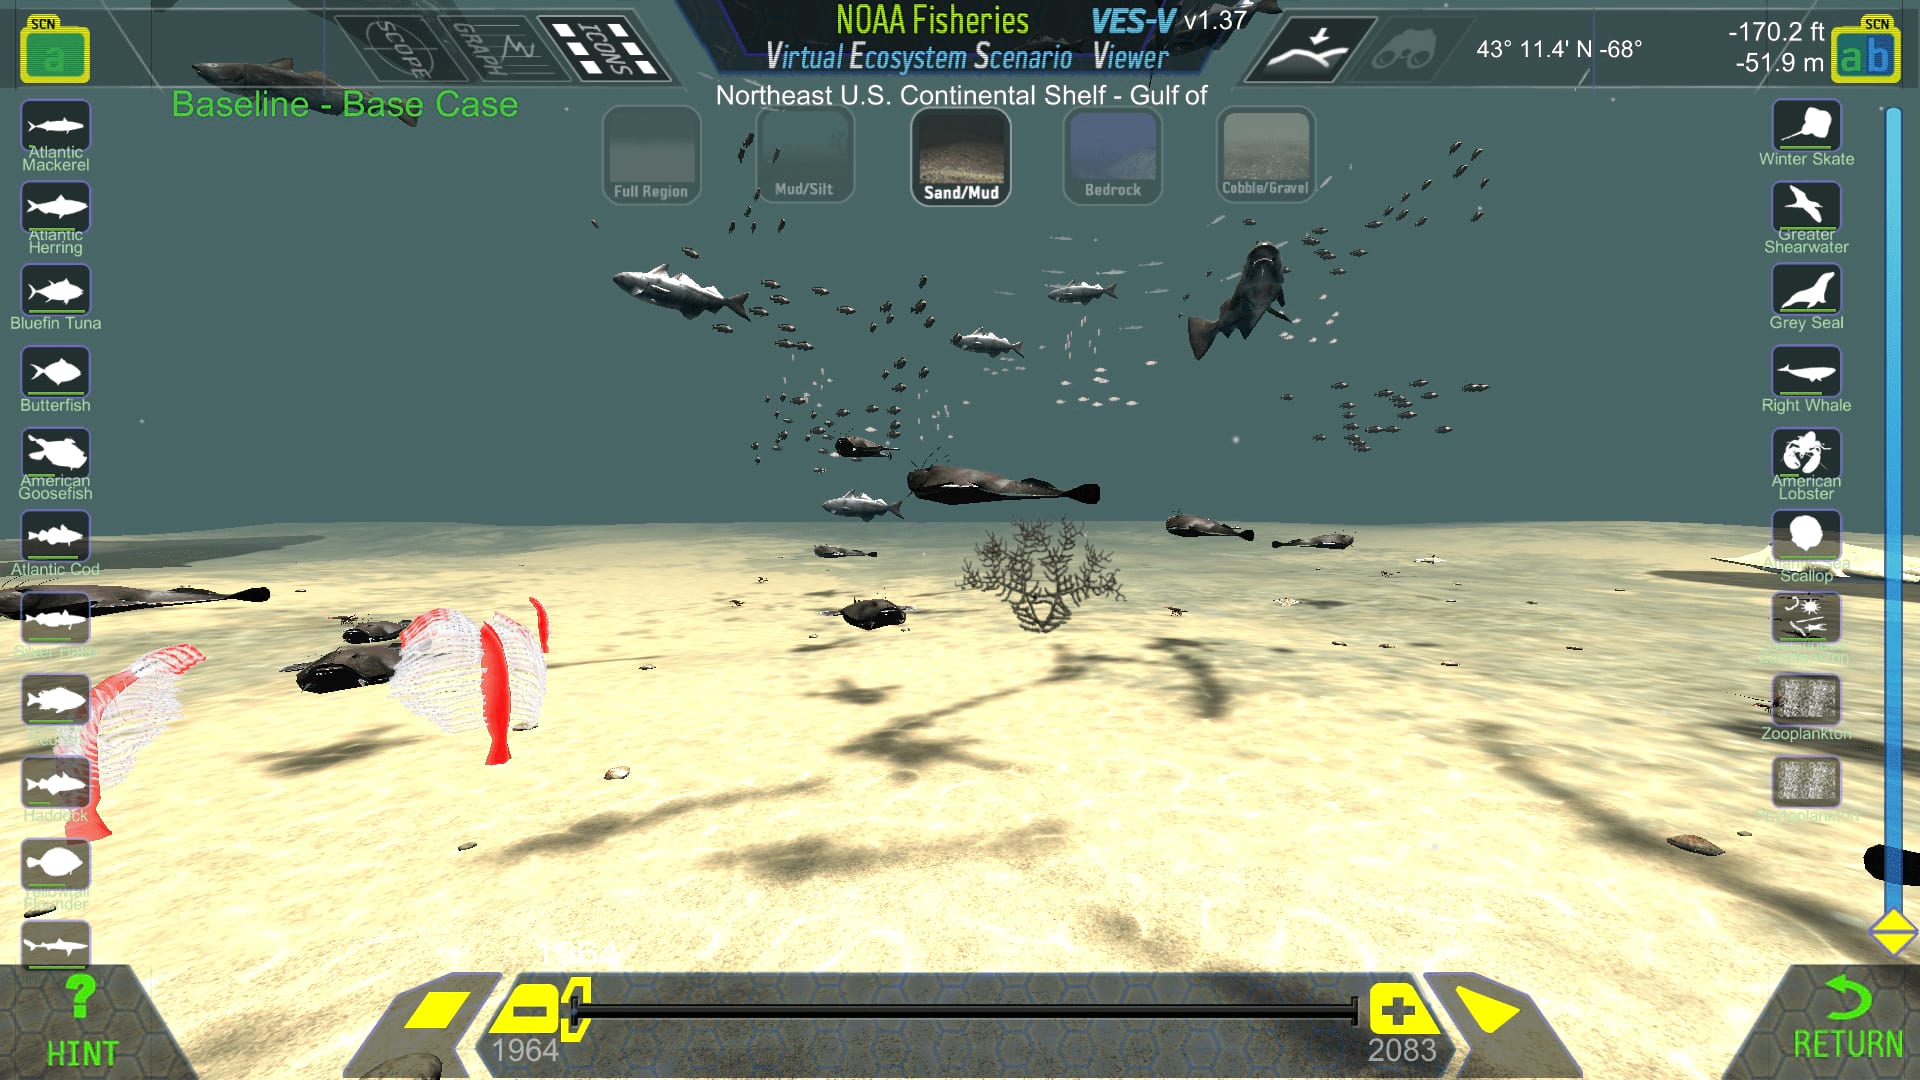
VES-V Screenshot 1: Sand Flats in the Gulf of Maine
Provide students with the VES-V Software Tutorial Worksheets which will walk them through the software, demonstrating its main features. Supplement the information in the worksheets with the notes and instructions below to lead students on a dive off the northeast coast of the USA in the Atlantic Ocean. If you plan to use a different habitat for the food web jigsaw activity, direct students there instead.
This guide provides a brief introduction to the Virtual Ecosystem Scenario Viewer (VES-V)
There are two versions of VES-V: one that runs online in a web browser, and a second that can be downloaded to a local computer. We recommend the online version.
If access to stable internet connections is a challenge you can also Download VES-V (nmfs-ecosystem-tools.github.io/VES-V) - choose the Windows, Mac or Linux version from the links near the bottom of the page. This approach can be particularly helpful if students are using a class set of computers. There is not a downloadable version for Chromebooks, so you must use the online version if you use a Chromebook.
NOTE: VES-V is a large software file, so it may take some time to download or to load into the web browser. VES-V also requires a fairly high-performance computer to run well; we STRONGLY recommend you test it on the types of computers available before using it with your class.
After you download and open VES-V, or after you launch the online version, work through the following steps to learn about the main features of VES-V.
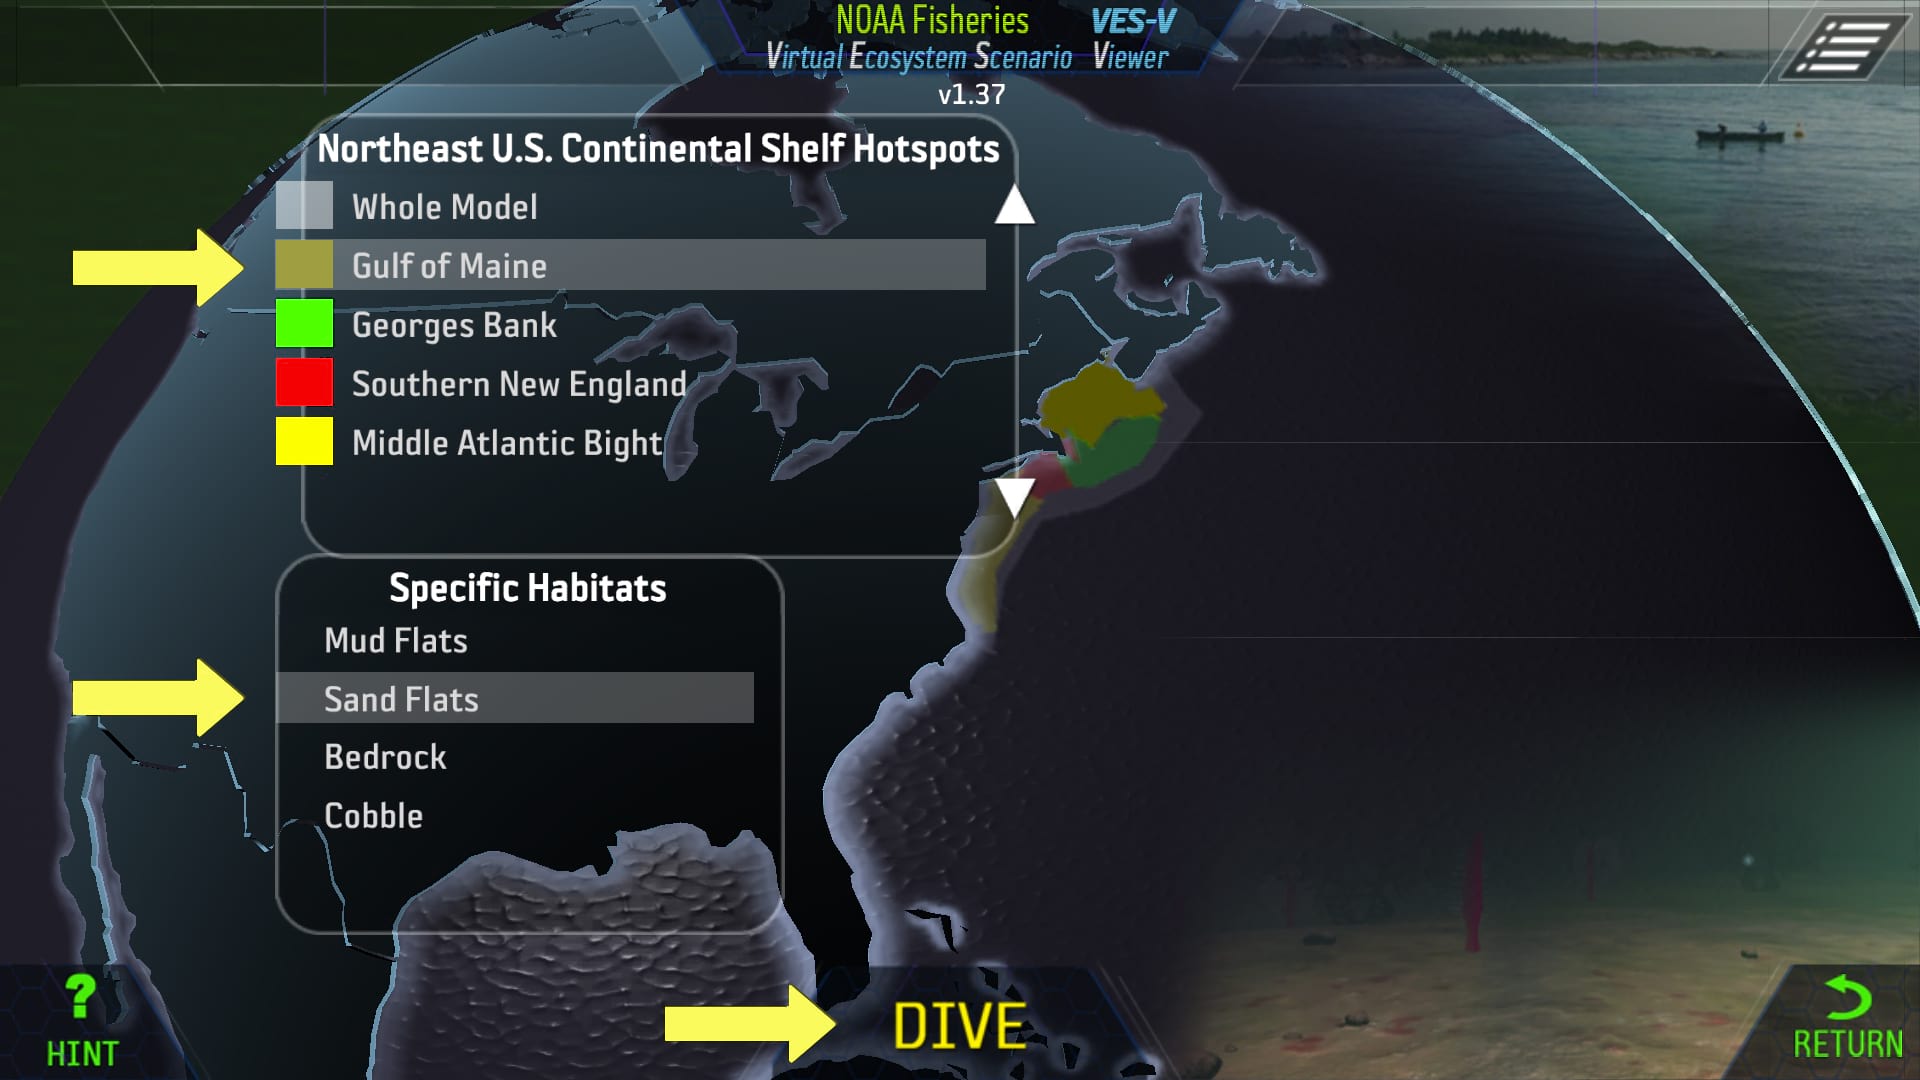
VES-V Screenshot 2: Navigating to Different Ocean Regions and Habitats
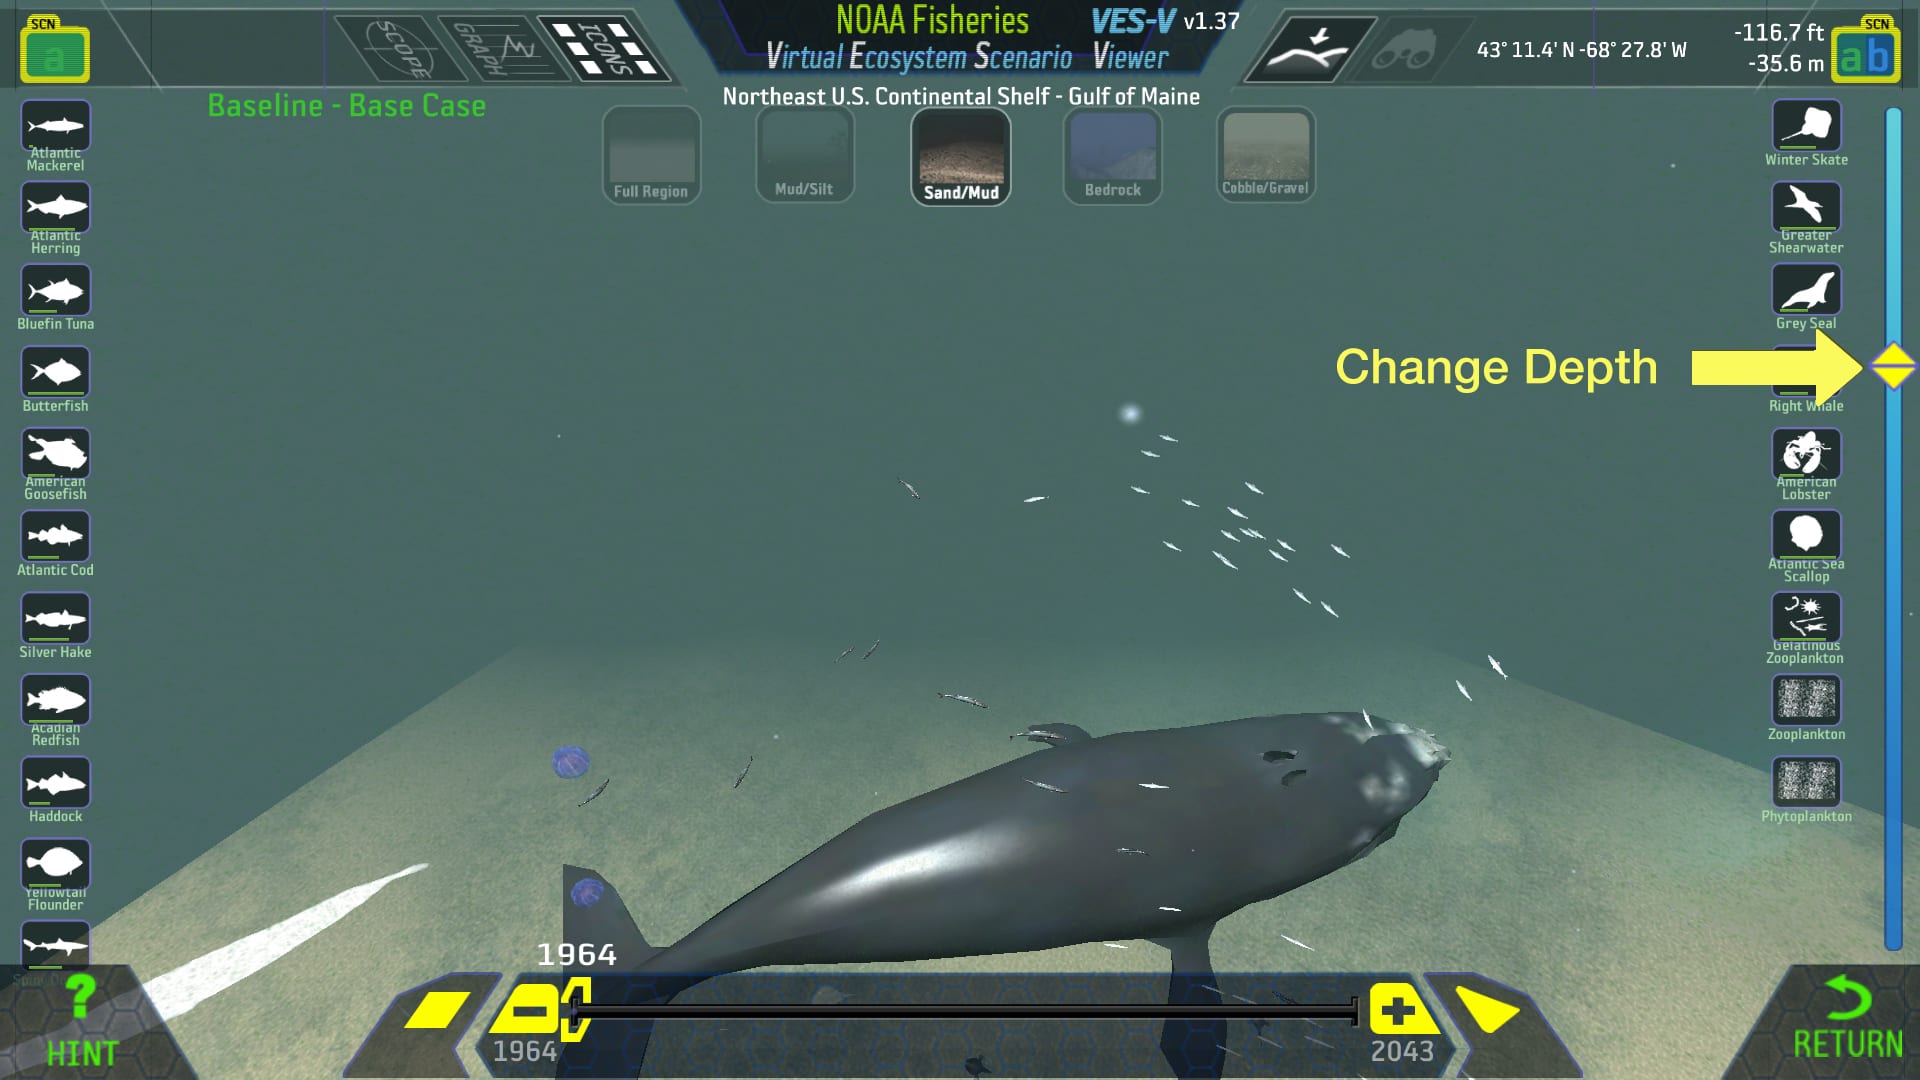
ES-V Screenshot 3: Navigating Within an Ocean Habitat
Click any of the species icons along the left or right edges of the screen, such as the “Atlantic herring” icon near the upper left. A graph of the biomass for that species spanning a number of years appears.
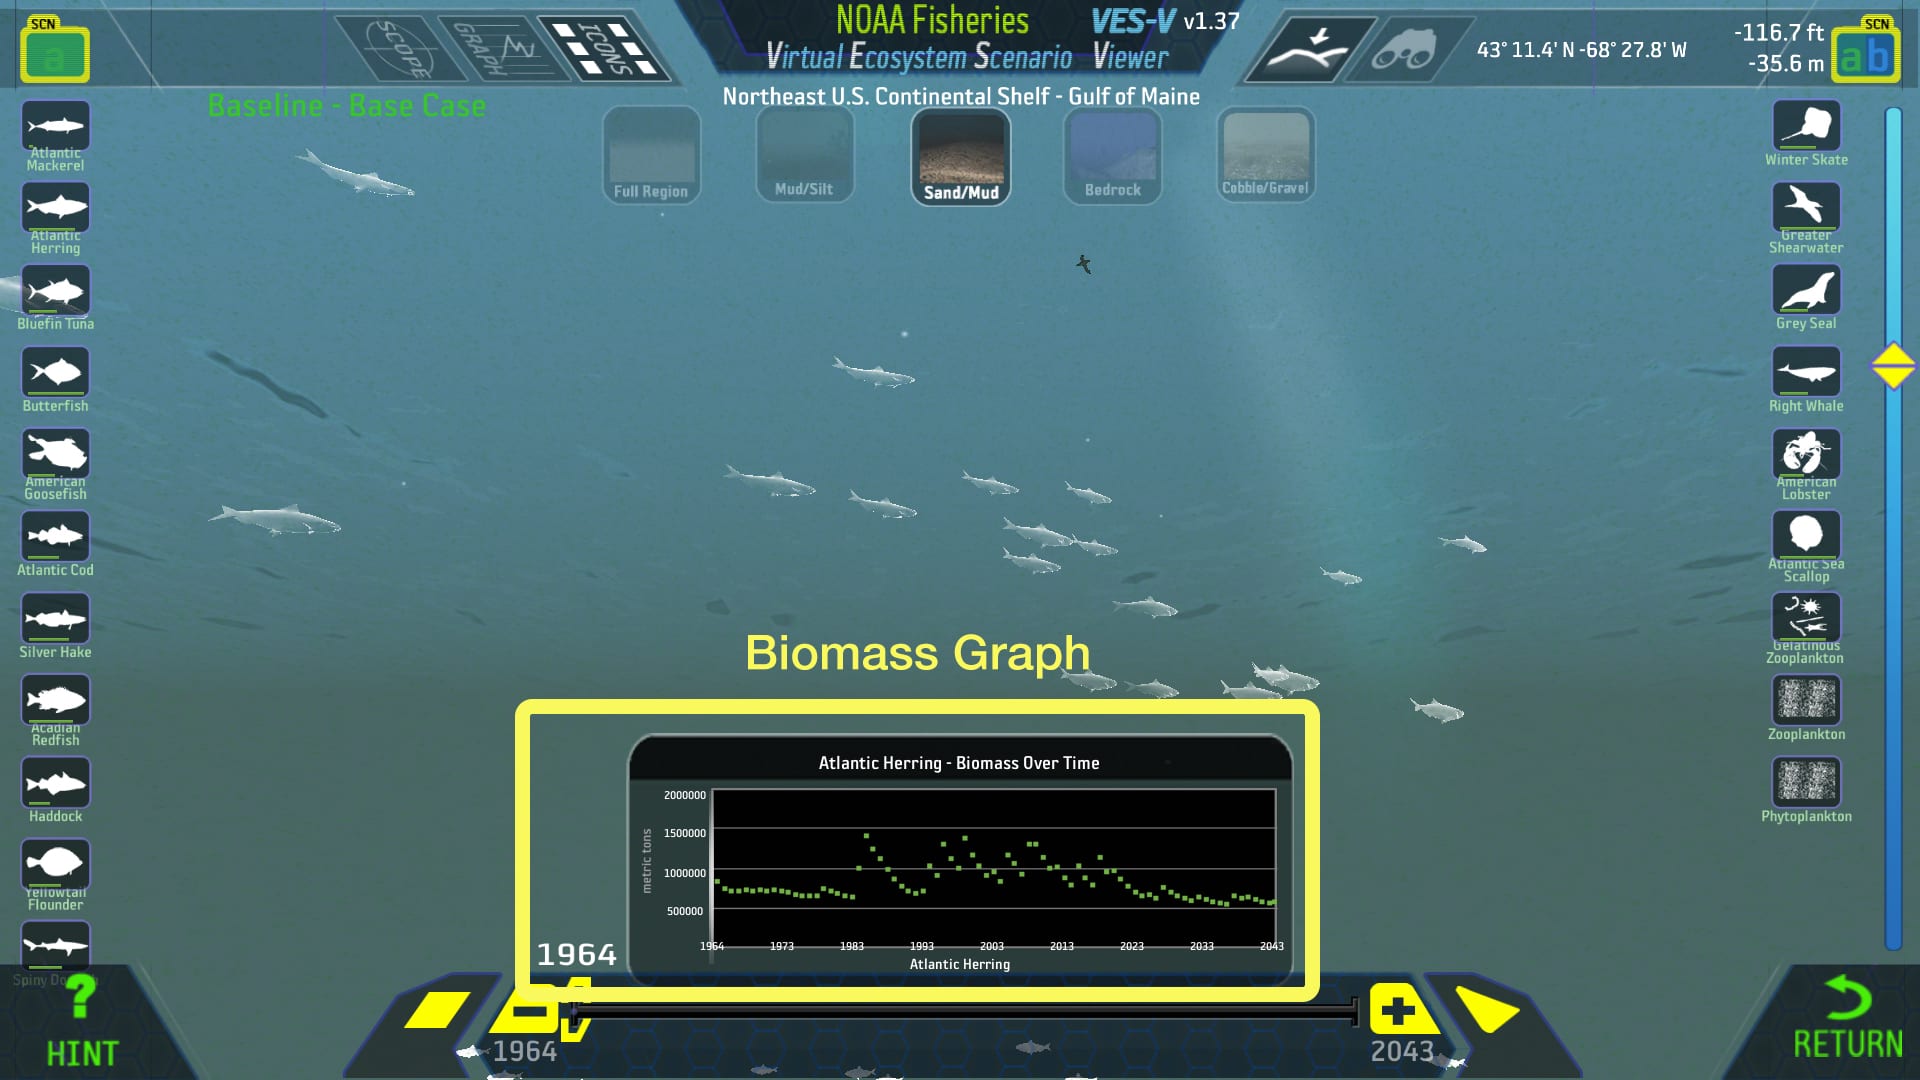
VES-V Screenshot 4: Obtaining Species Specific Biomass Data
The yellow slider control immediately below the graph adjusts the year that the VES-V visualization displays. Drag it right or left to change the year. More or fewer fish and other species may appear as you move the slider, corresponding to the biomass for each year.
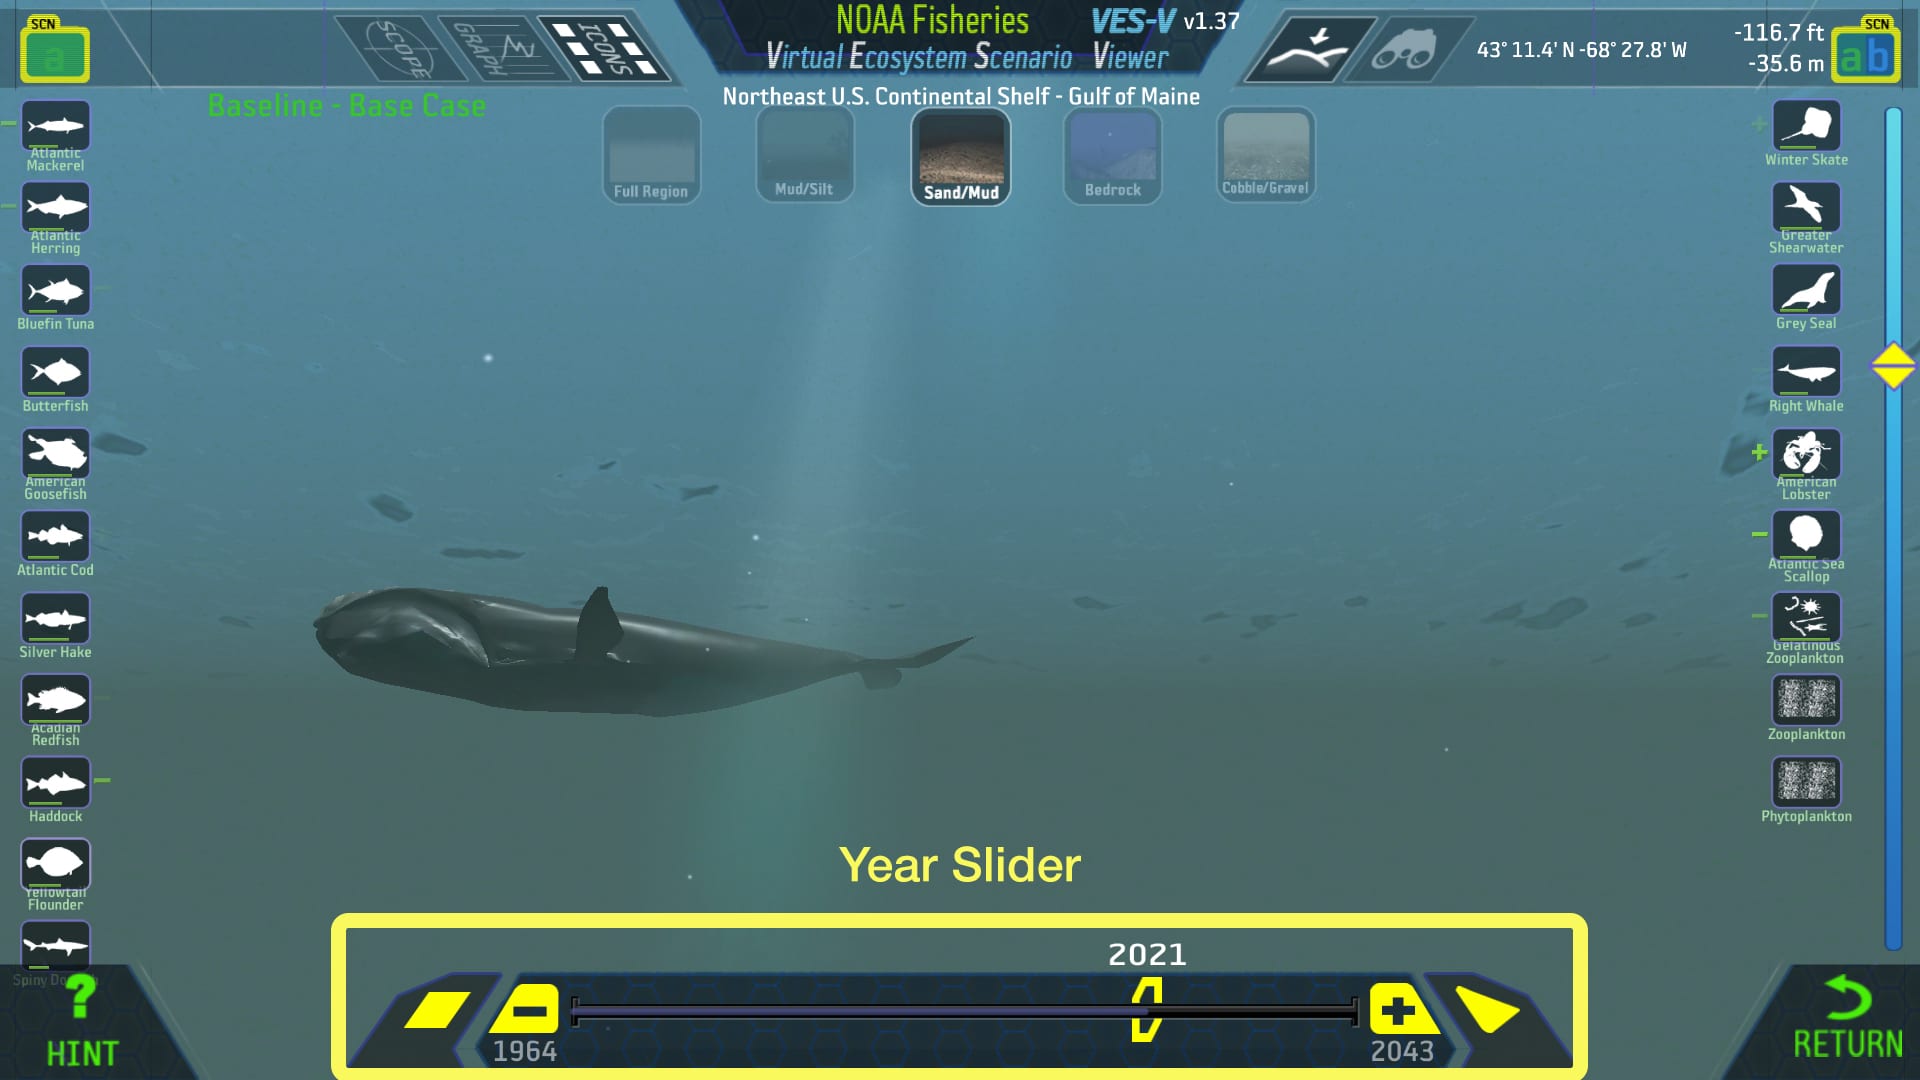
VES-V Screenshot 5: Adjusting the Year of the VES-V Visualization
With one of the species icons still selected (and its graph showing), click the binocular icon to the right of center along the top edge of the screen. VES-V will adjust the view to try to place as many species as possible of the type selected into the view screen.
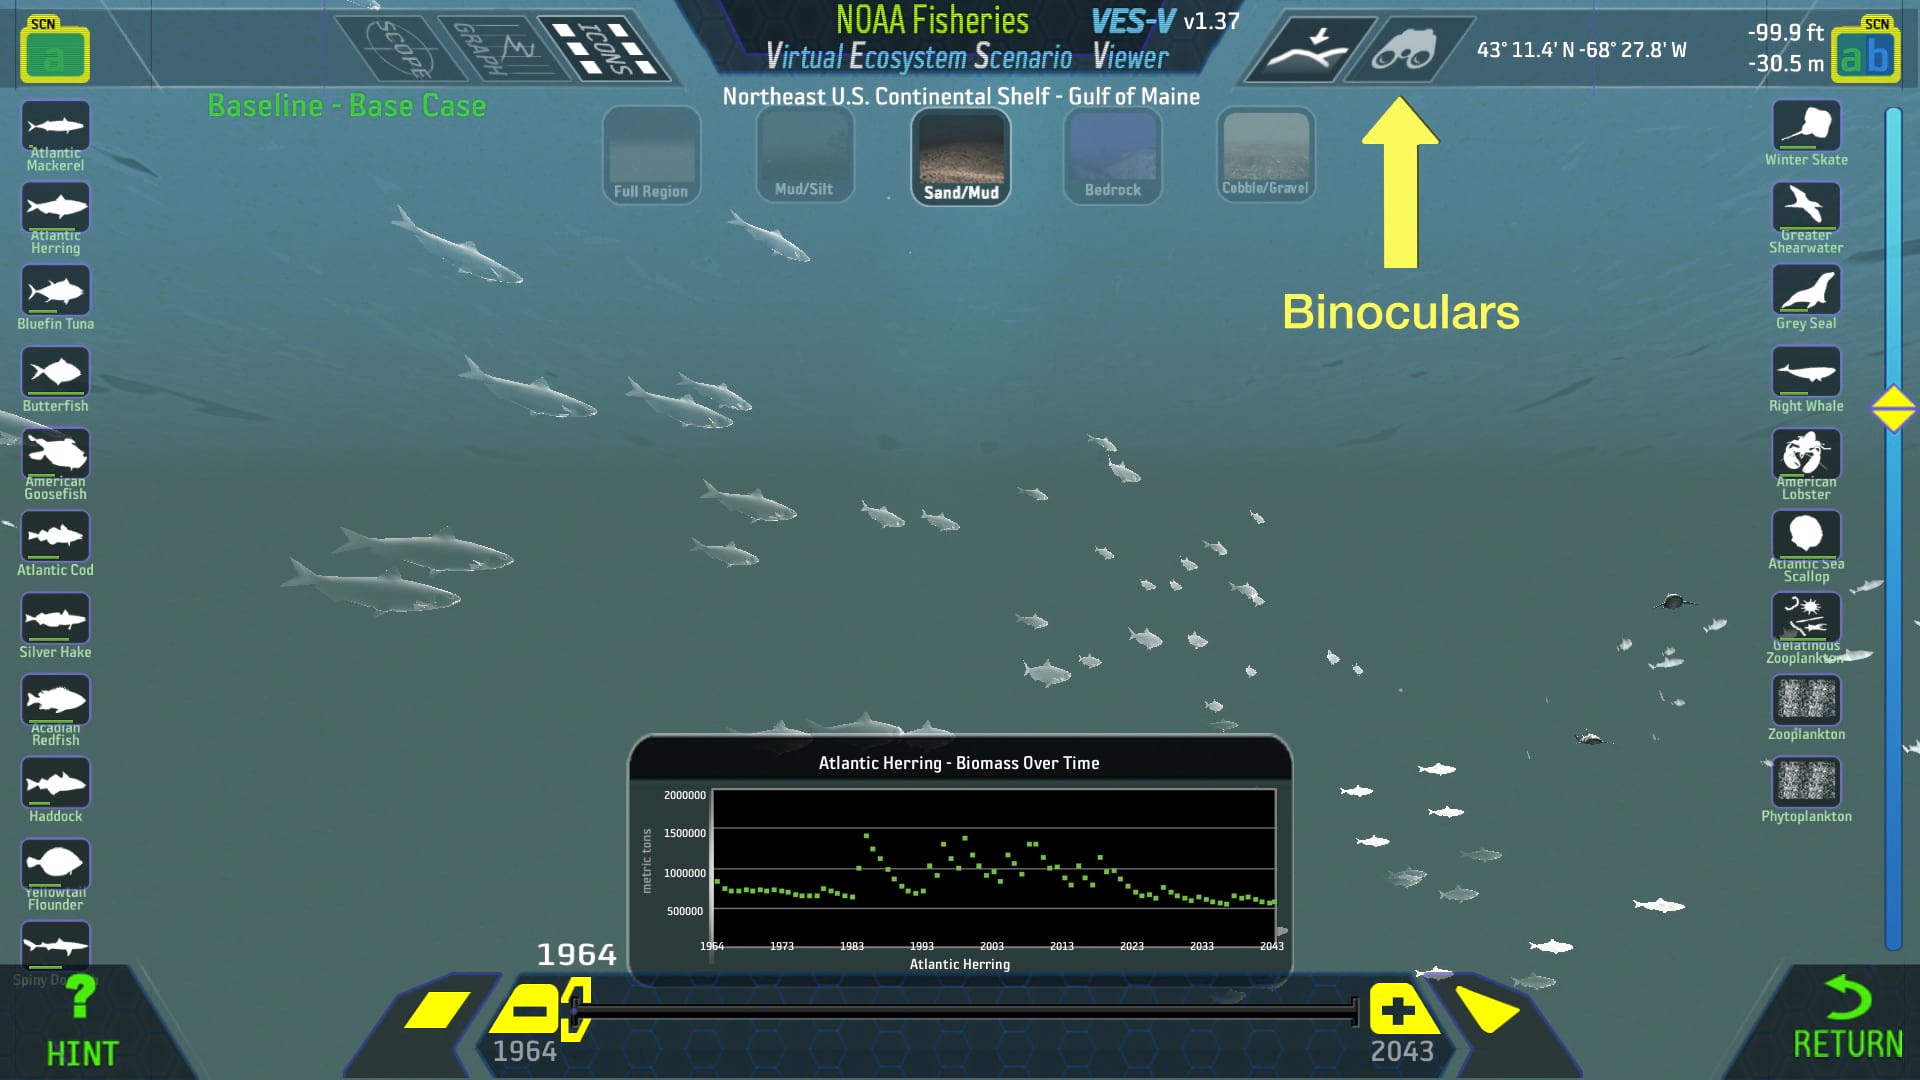
VES-V Screenshot 6: Viewing as Many Selected Species as Possible in the View Screen
Click on the selected species icon a few times. Notice how species of that type in VES-V switch between a ghostly white display and a normal, colored display as you select and de-select the species icon.
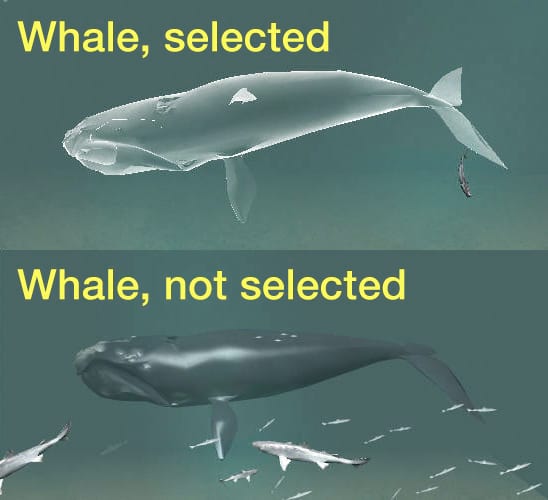
VES-V Screenshot 7: Selecting a Specific Species Within a Habitat
Click the green icon in the upper left, that looks like a file folder and has the letters SCN on it, to choose a different scenario. A list of scenario options appears in the center of the screen.
NOTE: In general, VES-V starts with the “Baseline” scenario selected by default. Click on a different scenario, such as “MarineProtectedAreas”, to switch. VES-V is now using a different dataset to populate the species displayed in the scene and to generate graphs of their populations over time. Most of these datasets are generated by models using different assumptions; such as changes in populations caused by changing ocean temperatures or an increase or decrease in fishing.
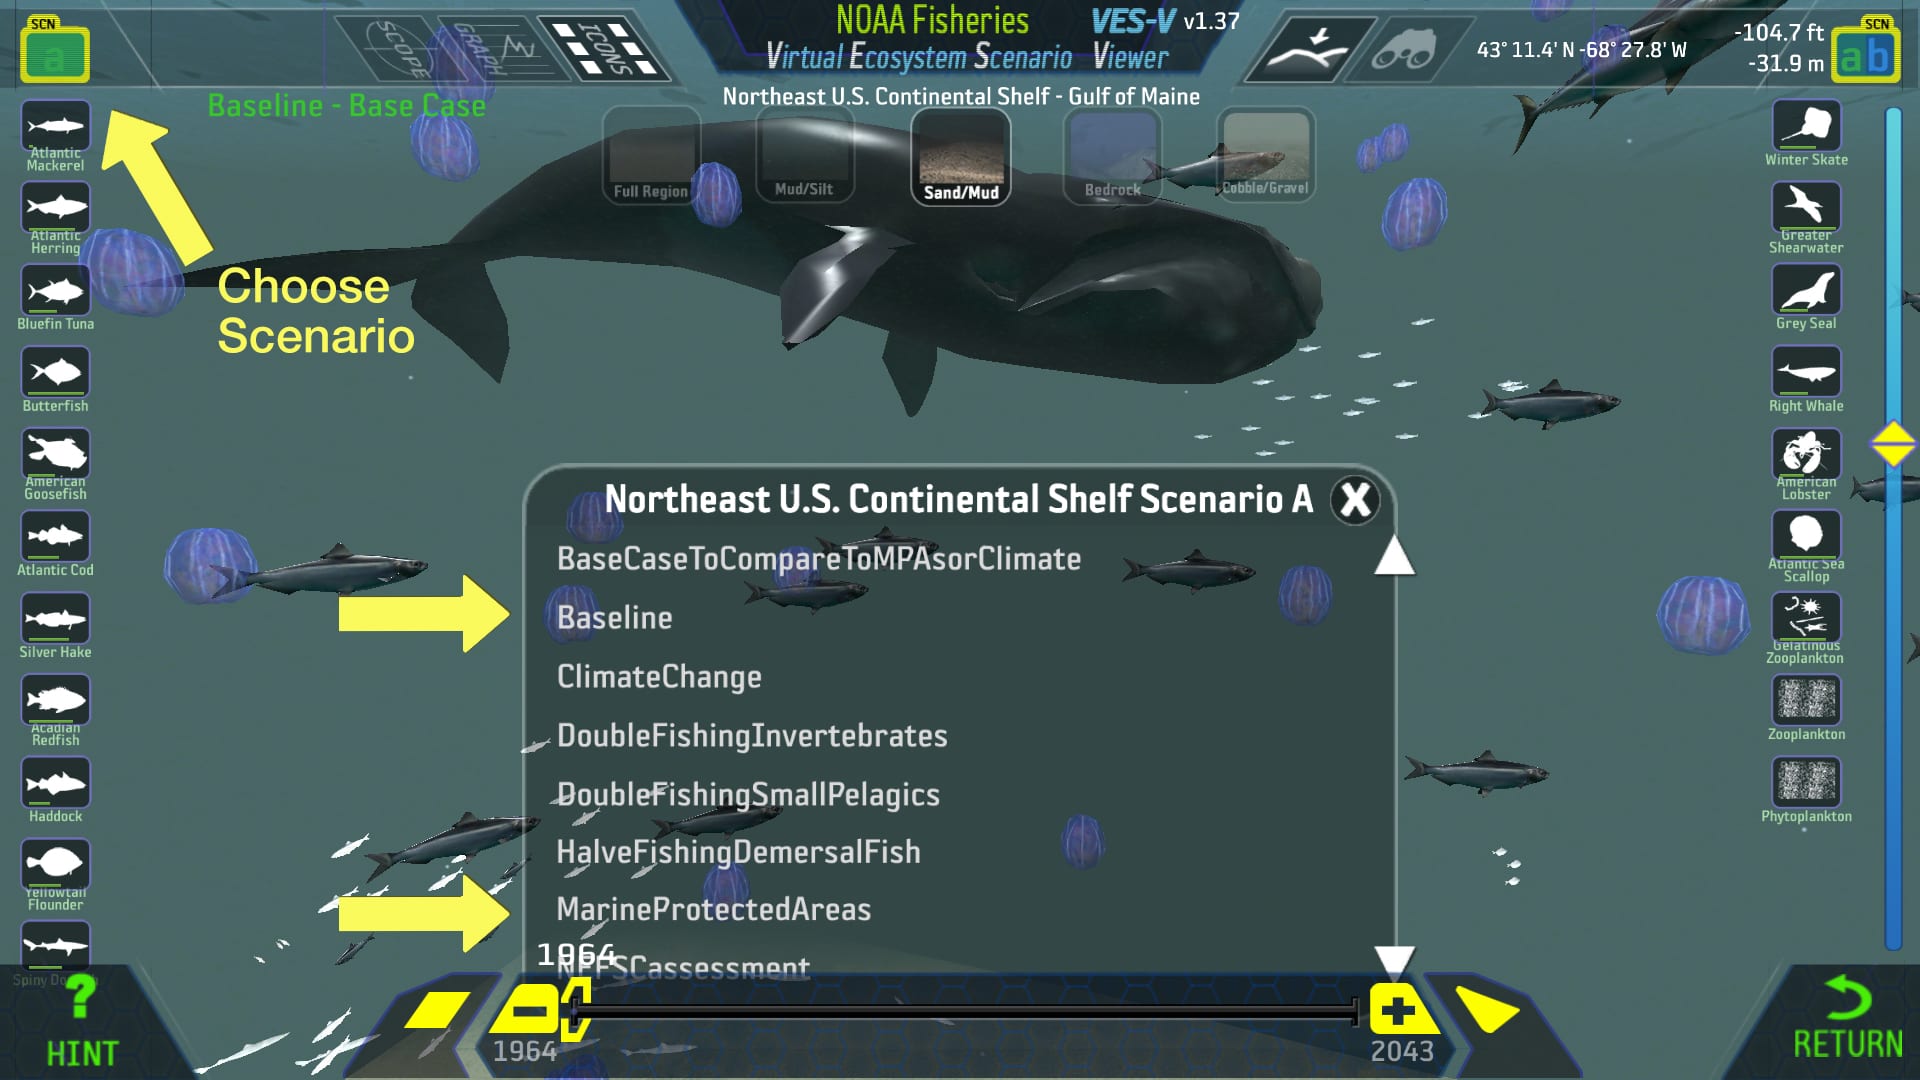
VES-V Screenshot 8: Selecting a Scenario Within a Habitat
Click the “Return” arrow in the lower right corner of the screen.
From this screen you can select a different habitat (Mud Flats, Bedrock, Cobble), you can select a different sub-region (such as the Georges Bank), or you can return to the main opening screen via the “Return” arrow button - and select a different region to explore.