CO-OPS issued 132 Storm QuickLooks for 16 storms and enhanced its Coastal Inundation Dashboard (CID). CID is a web mapping application for monitoring elevated water level conditions along the coast during storms. The new multistation viewing feature allows users to query data for up to 20 water level stations.
CO-OPS compiled peak water level information and provided it to the National Weather Service immediately following each storm. For the fourth year, CO-OPS communicated real-time water level information on NOS social media during storms. Hurricane Ida content was extremely popular, generating 62 times its normal distribution.
CO-OPS Establishes Temporary Water Level Stations in Louisiana
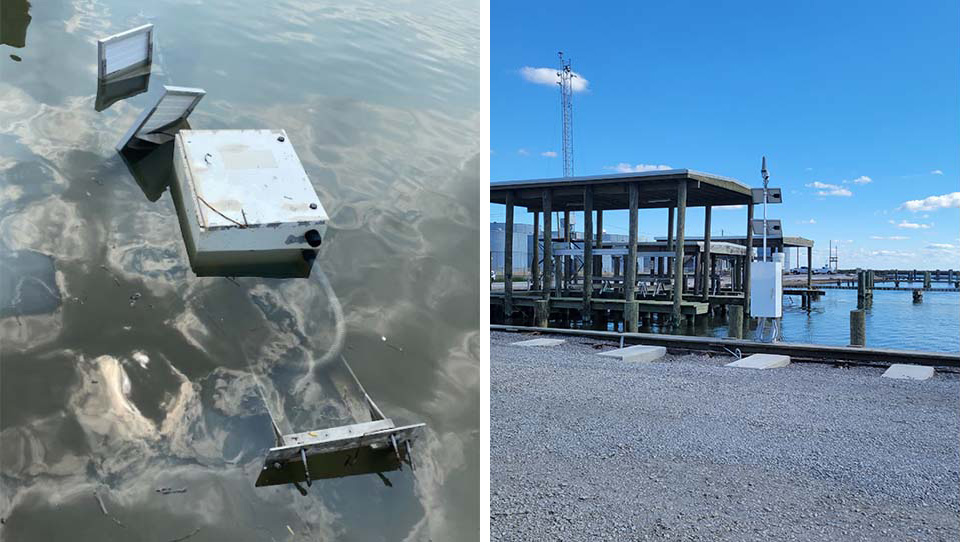
In Fiscal Year 2021, CO-OPS successfully established two temporary water level stations in Louisiana after permanent stations were damaged by hurricanes. The temporary stations will ensure continued collection and dissemination of real-time oceanographic and meteorological data at those locations until more permanent stations can be rebuilt. The Freshwater Canal Locks National Water Level Observation Network station, damaged in 2020 by Hurricane Laura, was reinstalled early in 2021. It was declared operational just ahead of Hurricane Delta and successfully captured peak water levels during that storm, which occurred only a week after installation. The Port Fourchon water level station at Belle Pass, damaged in 2021 by Hurricane Ida, was reinstalled at the end of the year. Data collected at this station supports the Port Fourchon Physical Oceanographic Real-time System (PORTS®). This CO-OPS StoryMap highlights the extent of extreme water levels experienced during an active hurricane season.
Port Fourchon, Louisiana: Hurricane-damaged water level station partially submerged in shallow water (left) and the rebuilt temporary installation affixed upright to the pier (right).
National Geodetic Survey (NGS)
NGS Collects Emergency Response Imagery After Hurricane Delta
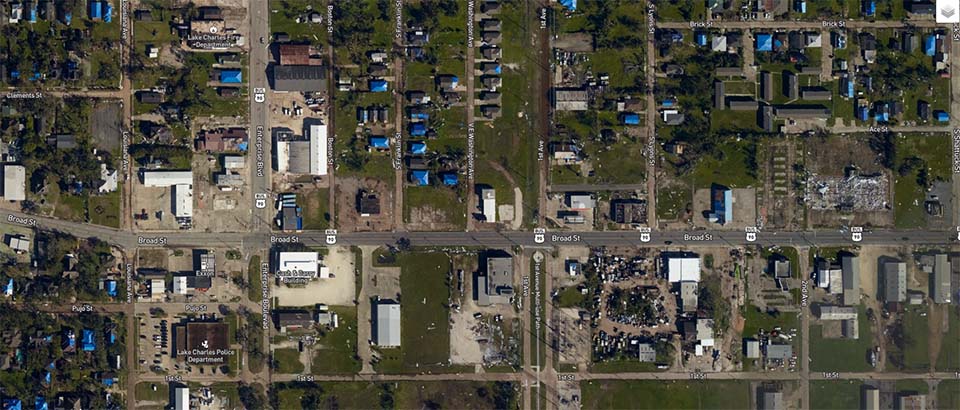
In October 2020, NGS collected aerial damage assessment images in the aftermath of Hurricane Delta. NGS flight crews collected images in specific areas identified by NOAA in coordination with the Federal Emergency Management Agency and other state and federal partners. The crew flew over more than 5,212 square kilometers (2,012 square miles) during 12 hours and collected 9,741 images. NOAA’s aerial imagery aids safe navigation and captures damage to coastal areas caused by a storm. Aerial imagery is a crucial tool to determine the extent of the damage inflicted by flooding, and to assess the damage to major ports and waterways, coastlines, critical infrastructure, and coastal communities. This imagery provides a cost-effective way to better understand the damage sustained to both property and the environment.
Aerial image showing blue tarps on damaged roofs in Lake Charles, Louisiana, after Hurricane Delta.
Office for Coastal Management (OCM)
OCM Provides Support During 2021 Hurricane Season
OCM assisted state research reserves and coastal zone management programs to help them and their constituents prepare for and respond to hurricanes. Efforts included a pre-season, peer-to-peer webinar held for Gulf, Southeast, and Caribbean partners to discuss hurricane preparedness and lessons learned from the active 2020 season. Through the online Digital Coast platform, OCM provided data and resources that aid recovery efforts, including lidar, elevation, and land cover data; risk and vulnerability assessment methods; and coastal flood inundation and impacts maps.
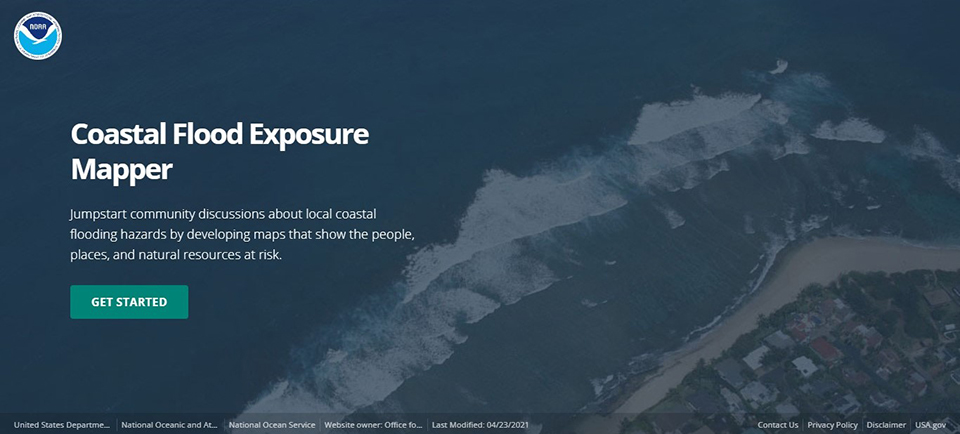
Tools like the Digital Coast’s Coastal Flood Exposure Mapper help NOAA partners and their constituents understand and prepare for hurricane impacts.
U.S. Integrated Ocean Observing System (IOOS®)
Hurricane Glider Project Digs into Ocean-storm Relationship
For the seventh year, NOAA, the U.S. Navy, and over 20 federal, state, research, and private sector partners collaborated on a project using underwater gliders to gather ocean information throughout the FY 21 hurricane season. The project’s goal is to accurately capture ocean conditions in models that support hurricane intensity forecasts.
This year, the project deployed 41 gliders into the Atlantic and Gulf of Mexico, joined by an additional 25 gliders deployed on independent missions, gathering temperature and salinity profiles. In total, there were 2,309 glider days, and the gliders gathered 78,328 temperature and salinity profiles. This data is available through the U.S. IOOS Glider Data Assembly Center, as well as being distributed through the World Meteorological Organization’s Global Telecommunications System and assimilated into the operational NOAA Real-Time Ocean Forecast System.
This year, the project introduced a new glider track that explored the Loop Current in the Gulf of Mexico, through the Florida Straits, connecting to the Gulf Stream, and traveling up the Atlantic coast. A glider was deployed near Louisiana and traveled south, and was recovered off the South Carolina coast near the end of hurricane season 2021. This glider gathered important data about these two ocean features, which have been linked to changes in storm intensification.
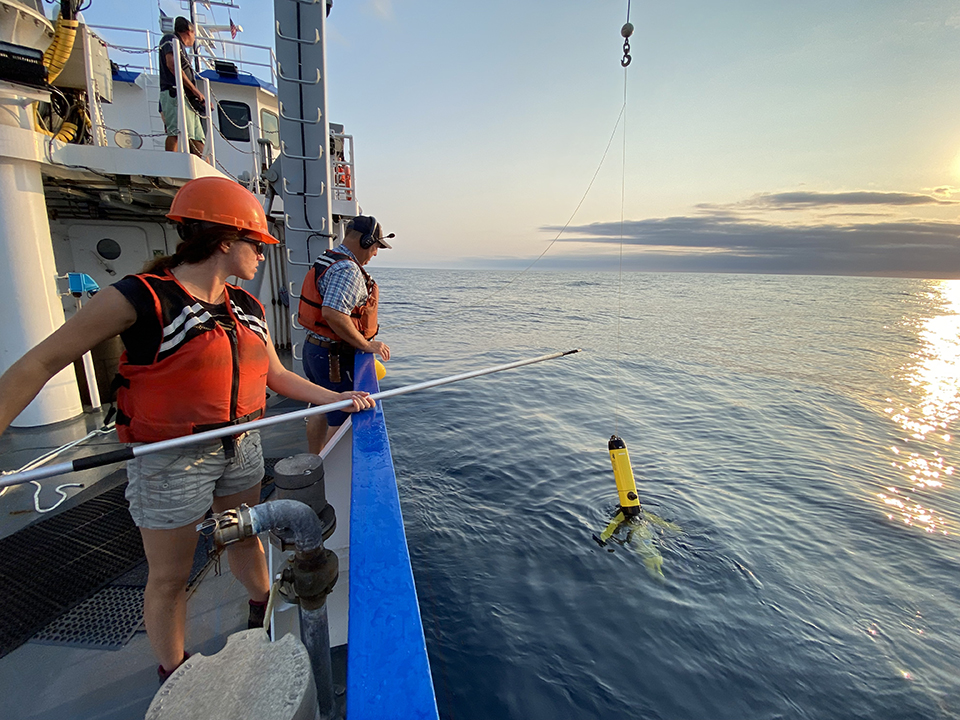
Crew of R/V Virginia working to recover a glider in the mid-Atlantic during the 2021 hurricane season as a part of the NOAA Hurricane Glider project. Photo Credit: Donglai Gong/Virginia Institute of Marine Science.
The hurricane glider project brings together a spectrum of agencies, research institutions, and companies to measure subsurface ocean information to improve the representation of the ocean in models used for hurricane intensity forecasting.
The U.S. Navy provided 15 gliders this season — the most since the project began — as part of the NOAA-Navy collaboration. One Navy glider in the Gulf of Mexico — NG645 — played a critical role in providing important observations ahead of Hurricane Ida. The glider traveled into a cold-water eddy where it measured a fresh water barrier layer. In fact, it was the only observing asset on the shelf that was available to capture that barrier layer. Fresh water barrier layers inhibit mixing and have been shown to prevent tropical cyclone weakening. When assimilated into models, the data showed ocean conditions were going to sustain Ida’s strength and were favorable for storm intensification.
Within NOAA, coordination between the NOAA's Pacific Marine Environmental Laboratory, Atlantic Oceanographic and Meteorological Laboratory, and IOOS southeast Regional Association SECOORA co-located saildrones and underwater gliders to observe surface and subsurface conditions in tandem. This is the first effort to gather simultaneous co-located observations of upper ocean and meteorological parameters from fully autonomous, uncrewed vehicles for hurricane studies and forecasts.
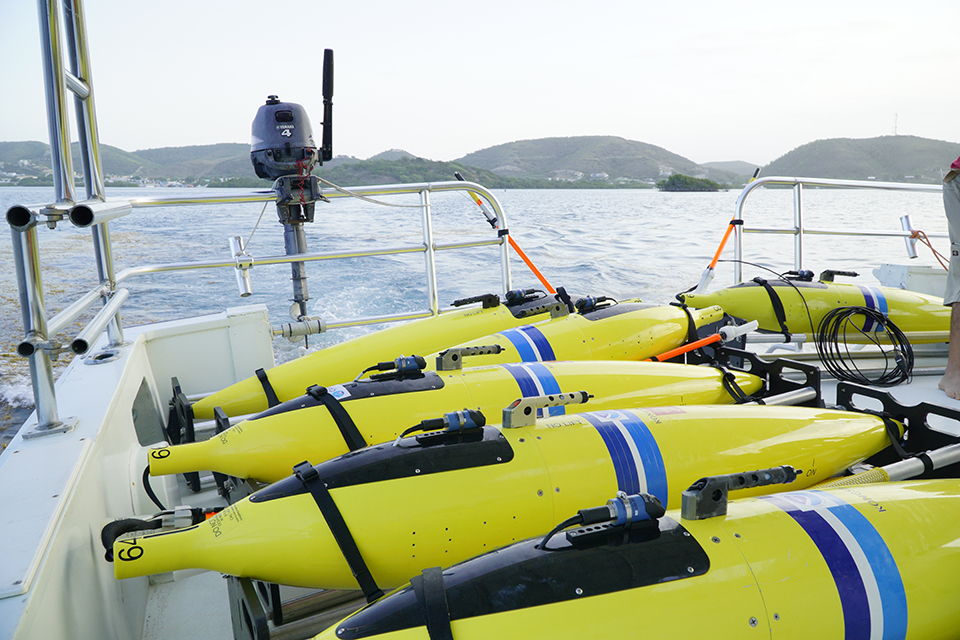
Gliders ready to launch into the Caribbean Sea as part of the 2021 Hurricane Glider project. Photo credit: Luis Rodriguez/CARICOOS.
Office of Response and Restoration (OR&R)
OR&R Hosts Hurricane Preparedness Summit
In June 2021, OR&R's Disaster Preparedness Program hosted its annual Hurricane Preparedness Summit for more than 140 virtual participants. The summit’s goal was to position NOAA and our close partners in a ready posture for storms such as Hurricane Ida, which made landfall as a Category 4 storm on August 29, 2021, devastating portions of southern Louisiana.
The two-day conference was facilitated by the Coastal Response Research Center, an OR&R partnership with the University of New Hampshire, and featured over 30 different speakers and covered topics ranging from National Weather Service storm surge modeling to aircraft operation by NOAA’s Office of Marine and Aviation Operations.
Presenters also spoke about incident command as well as power and utility loss logistics, a timely topic of discussion months before Hurricane Ida’s impact on southern Louisiana. Speakers were both internal and external to NOAA and included other state and federal agencies such as the U.S. Coast Guard, the Federal Emergency Management Agency, the Florida Department of Environmental Protection, and the Louisiana Governor’s Office of Homeland Security and Environmental Protection.
 An official website of the United States government.
Social