Center for Operational Oceanographic Products and Services
NOS Fiscal Year 2021 Year in Review
NOAA’s Center for Operational Oceanographic Products and Services (CO-OPS) is the authoritative source for accurate, reliable, and timely tides, water levels, currents, and other vital coastal oceanographic and meteorological information.
CO-OPS Expands PORTS® to Increase Navigation Safety
SUPPORTS NOS PRIORITIES: SAFE AND EFFICIENT TRANSPORTATION AND COMMERCE; PREPAREDNESS AND RISK REDUCTION
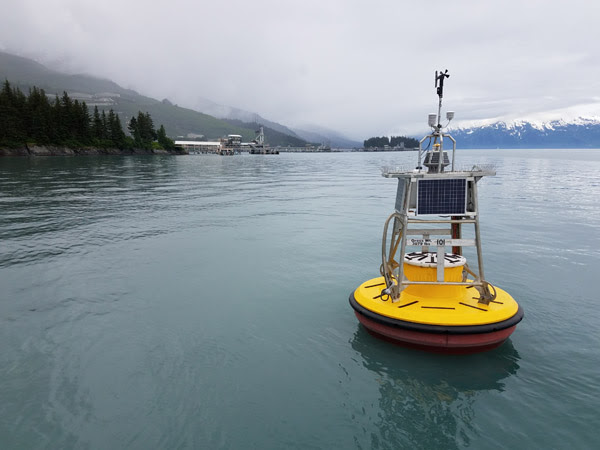
Buoy off Jackson Point in Port Valdez, Alaska. Credit: Austin Love/Prince Williams Sound Citizen Advisory Council
Fiscal Year 2021 marked the 30th anniversary of NOAA’s Physical Oceanographic Real-Time Systems (PORTS®). The PORTS program provides real-time oceanographic and meteorological observations to help mariners safely navigate increasingly congested shipping lanes and busy seaports. To commemorate the anniversary, CO-OPS held congressional briefings and launched an updated PORTS landing page that featured the customizable MyPORTS application, a new system map, and an outreach video for stakeholders.
In FY 21, CO-OPS collaborated with partners across the nation to expand several existing PORTS, adding new sensors in Chesapeake, Virginia; Corpus Christi, Texas; Galveston/Houston, Texas; Humboldt Bay, California; Jacksonville, Florida; Mobile Bay, Alabama; and Sabine Neches, Texas. CO-OPS also partnered with the Prince William Sound Regional Citizens’ Advisory Council to add a new system near Port of Valdez, Alaska, and announced the establishment of three future PORTS partnerships in Freeport, Texas; Kitsap Peninsula, Washington; and Pearl Harbor-Honolulu, Hawaii. There are 36 PORTS nationwide. CO-OPS looks forward to expanding this important program in FY 22.
SUPPORTS NOS PRIORITIES: SAFE AND EFFICIENT TRANSPORTATION AND COMMERCE; PREPAREDNESS AND RISK REDUCTION
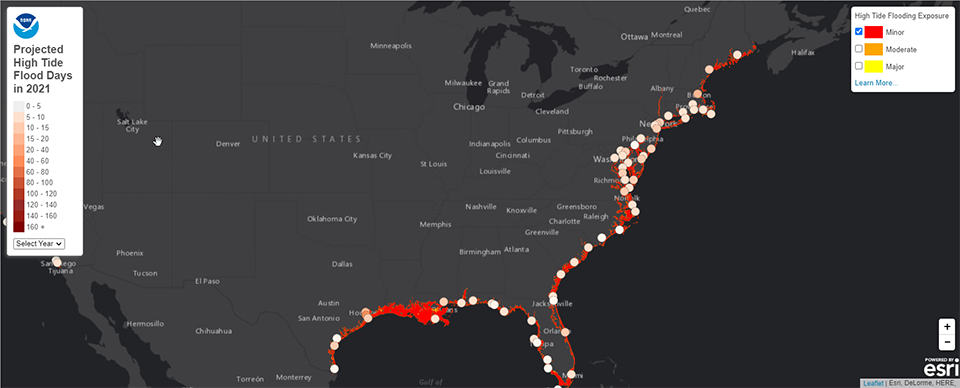
CO-OPS expanded and improved several of its sea level rise and climate outlook capabilities over FY 21. The changes were designed to anticipate coastal resilience needs of at-risk communities across the nation. They included improved statistics for NOAA’s State of High Tide Flooding and Annual Outlook Report; new flooding exposure parameters for NOAA’s High Tide Flooding Map; modernized mean sea level animated graphics for the Climate.gov Climate Resilience Toolkit; expanded geographic coverage for the seasonal high tide bulletin; and enhancements to the Coastal Inundation Dashboard that resulted in the added functionality of multistation viewing as well as the addition of data for historical flooding and water level stations in the Great Lakes.
As part of its resilience efforts, CO-OPS also supported the fifth National Climate Assessment report and data services for GlobalChange.gov. In FY 22, CO-OPS will begin developing a collaborative, multiyear project to conduct a 40-year re-analysis of water level data to build a national assessment for contemporary and future flooding.
Updated high tide flooding map, which now includes exposure parameters for minor, moderate, and major flooding.
CO-OPS Enhances Operational Forecast Systems, Rip Current Predictions
SUPPORTS NOS PRIORITY: PREPAREDNESS AND RISK REDUCTION
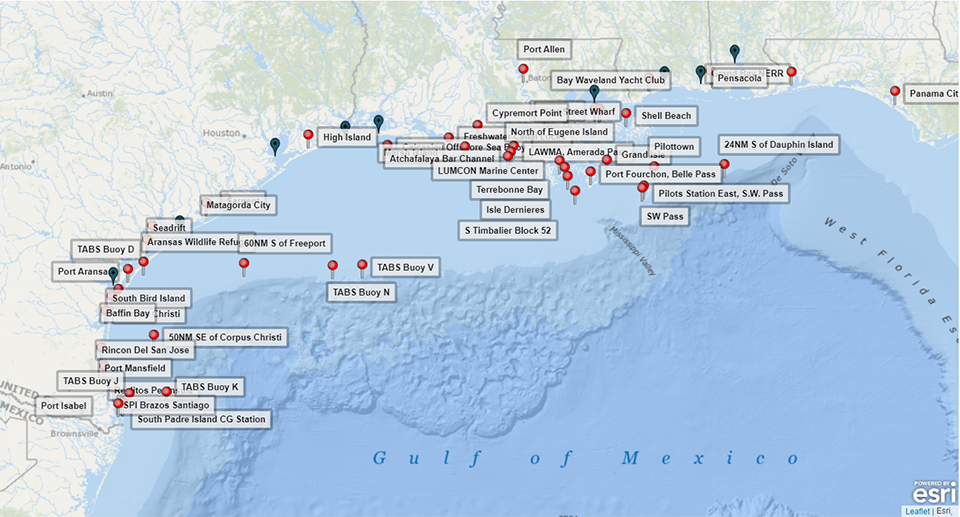
Collaboration between CO-OPS; the U.S. Integrated Ocean Observing System; the National Environmental Satellite, Data, and Information Service; and the Office of Coast Survey led to the development and implementation of two new Operational Forecast Systems (OFS) for the West Coast and in the Gulf of Mexico. Both models feature technological advancements not used in previous systems. The new West Coast OFS is the first of its kind to feature real-time data assimilation, while its counterpart in the Northern Gulf of Mexico (NGOFS2) features high-resolution output and consolidates three separate models into one. This new NGOFS2 model also expanded forecasting coverage to the Mexican border and upstream into major rivers and estuaries.
CO-OPS also contributed to another modeling milestone in FY 21 — the launch of the first National Rip Current Forecast Model. Developed collaboratively between the National Ocean Service and the National Weather Service (NWS), the model leverages wave and water level data to predict the hourly probability of rip currents along U.S. coasts up to six days out. Data for the model is provided by NWS’s Nearshore Wave Prediction System. CO-OPS water level data and observations are used to validate and fine tune that system. In FY 22, CO-OPS will work with its partners to expand coverage of this lifesaving tool beyond its current range.
Map depicting the sensors included in the recently upgraded NGOFS2.
CO-OPS Transitions New Observing System Technology to Operations
SUPPORTS NOS PRIORITY: PREPAREDNESS AND RISK REDUCTION
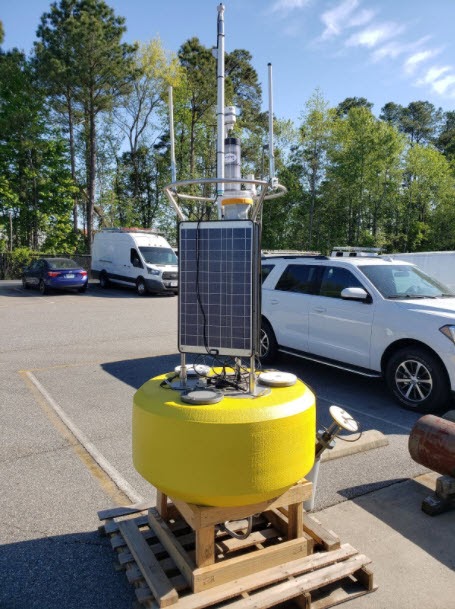
Fully integrated CURBY system.
In FY 21, CO-OPS’s new real-time current buoy, or CURBY, was identified as a quickly deployable tool to help incident responders in NOAA’s Office of Response and Restoration (OR&R) more accurately predict the trajectory of spilled pollutants. CO-OPS worked with OR&R to secure funding for two new CURBY systems along the Gulf Coast. CO-OPS delivered one CURBY to OR&R’s Disaster Response Center and one to its Pensacola, Florida, office and provided training to both groups. CO-OPS also developed, tested, and deployed its new current meter mooring SEABY (subsurface ellipsoidal ADCP buoy) this year. SEABY were first deployed for the Delaware River and Bay Tidal Currents Survey led by CO-OPS’s National Currents Observation Program. SEABY data is used to update NOAA’s Tidal Current Tables and validate the Delaware Bay Operational Forecast System.
CO-OPS also made substantial progress in transitioning primary water level sensors used in the National Water Level Observation Network (NWLON) from acoustic to microwave water level (MWWL) technology. In FY 21, 18 new sensors were successfully installed, bringing the total number of MWWL sensors at NWLON stations to 96. The new non-contact microwave sensors deliver more accurate measurements, reduce maintenance costs, and offer the potential to provide wave measurements.
 An official website of the United States government.
Social