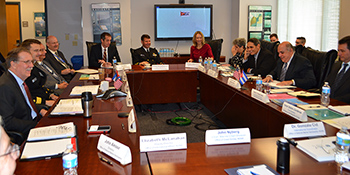
Officials from Cuba’s charting agency traveled to Maryland and met with National Ocean Service representatives in December 2015, as the agencies began to formulate the memorandum of understanding on cooperation to improve maritime navigation safety and related areas of mutual interest – to protect lives and property at sea. The countries signed the MOU in Havana on March 18, 2016.
NOAA's navigation services office's (CO-OPS,IOOS, NGS, OCS) directors and subject experts traveled to Havana to meet with their counterparts in Cuba's National Office of Hydrography and Geography. The U.S. and Cuba have expressed their joint commitment to pursuing the improvement of maritime safety through the exchange of modern hydrographic data and products. A Memorandum of Understanding (MOU) was signed in March 2016 to improve maritime navigation safety and related areas of mutual interest to protect lives and property at sea. In the MOU, both agencies agreed to "develop annual work plans to identify specific priority activities for cooperation." Among a range of activities, the U.S. looks forward to coordinating electronic navigational charts production and facilitating international charts; improving tides and currents monitoring and forecasting; and collaborating on geodetic challenges. This agreement is the first step in what is expected to be a long-term collaboration between the two countries.
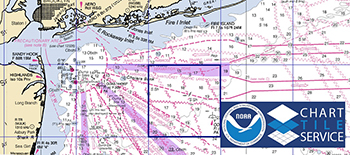
Coast Survey has created millions of tiles, covering over a thousand NOAA raster navigational charts, so electronic charting systems and apps can use the smaller tile files to speed updates to users.
In recent years, larger manufacturers have switched to using NOAA raster charts but experienced problems with downloading NOAA’s huge chart files that take a long time to upload. In response, NOAA’s Office of Coast Survey collaborated with the navigation electronics industry to create new chart tile products and services to alleviate this problem. The new service provides digital chart users with faster and easier updates. The first phase, completed in December 2015, allowed commercial users to update their charts by accessing tiles (sections of nautical charts) online. The final phase packages tile sets within geographic regions for offline use. Users like recreational boaters are now able to download geographic packages that are updated weekly and contain only those tiles that have changed since the last full package. This dramatically reduces the bandwidth requirements necessary to keep a vessel’s chart suite up to date.
Cartographers and hydrographers from twelve countries gathered in Maryland this past July to participate in a three-day NOAA workshop on evaluating the adequacy nautical charts. During the workshop, they learned techniques to evaluate the suitability of nautical chart products using chart quality information and publicly available information. The participants then generated key layers in adequacy assessments such as: 1) using automatic identification systems (AIS) information to classify navigational routes; 2) comparing satellite-derived bathymetry or other surveys of opportunity with the existing chart, to identify areas that showed significant bathymetric changes; and 3) classifying chart quality information.
By involving the guest cartographers and hydrographers in hands-on layer development and use, instructors demonstrated that the procedure is a low-cost tool that can help any hydrographic office assess the adequacy of its charts. Participants came from Barbados, Brazil, Canada, Japan, Malaysia, Pakistan, Peru, Russia, Vietnam, Netherlands, Mexico, and Thailand.
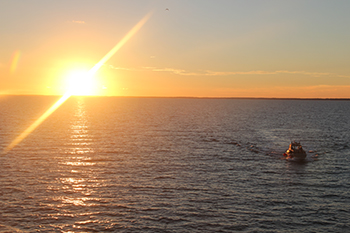
Small survey vessel deploys from NOAA Ship Thomas Jefferson to acquire navigational chart update data off the coast of Virginia
NOAA began a gradual rollout of a new nautical chart feature called the zone of confidence or ZOC box. Since charts are generally made up of data collected throughout the last century or longer ago, the ZOC tells the chart user when data were collected for specific portions of the chart, allowing the mariner to evaluate the risk level of navigating the area. As an example, the ZOC tells mariners if they are navigating in an area using data from the era of Captain Cook (circa 1778), data acquired by modern sonar, or something in between. The mariner is now better able to assess the chart’s reliability. The new ZOC classifications are derived more consistently, using a combination of survey data, position accuracy, depth accuracy, and seafloor coverage. NOAA nautical charts, mandated by statute, provide the coastal intelligence necessary for safe and efficient navigation.
The Hurricane Surge On-demand Forecast System (HSOFS) was successfully implemented for operational use on NCEP Central Operations’ high performance computing system. The model grid and testing was originally developed in a project with AECOM and Riverside Technology, Inc., and further testing and transition to operations was coordinated through the Coast Survey Development Laboratory’s Storm Surge Team. HSOFS is a hurricane storm surge forecast system based on ADvanced CIRCulation (ADCIRC), an advanced, large-scale storm surge model with local high resolution to predict flooding in coastal communities. HSOFS simulates water levels as hurricanes track across the Western Atlantic Ocean and Gulf of Mexico, and covers the coast from Texas to Maine including Puerto Rico and the U.S. Virgin Islands. Each operational run of HSOFS includes an ensemble of five simulations in which modifications are made to the National Hurricane Center’s (NHC) Forecast Advisory track (official, right shift, left shift, more/less intense). Operational implementation of HSOFS is intended to be used near the time of hurricane landfall to provide additional guidance to the NHC.
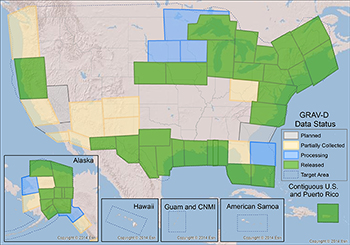
GRAV-D reaches 50 percent milestone of gravity completion.
The National Geodetic Survey’s (NGS) Gravity for the Redefinition of the American Vertical Datum (GRAV-D) project is covering the United States and its territories with airborne gravity measurements to facilitate the creation of a new national vertical reference system slated for launch in 2022.
In FY2016, GRAV-D achieved the major milestone of having surveyed more than 50 percent of the total project area. With each one percent of the project area equating to approximately 100 flight hours, GRAV-D has collected and processed data from a total of about 5,000 flight hours. More than three million square miles of data collection and processing have been completed across the continental United States, Alaska, Puerto Rico and the U.S. Virgin Islands.
The new vertical reference system scheduled for release in 2022 will be built upon GRAV-D airborne gravity data, together with both terrestrial and satellite data. Once implemented, GRAV-D will provide an estimated cost savings of $4.8 billion to the Nation from infrastructure cost savings, inundation models for storm surges and tsunamis, and coastal intelligence and resilience initiatives for communities.
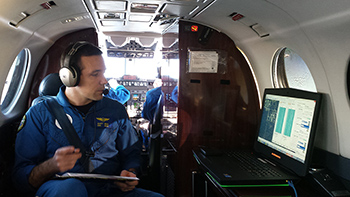
LT Scott Broo acquiring aerial imagery aboard the NOAA King Air aircraft.
In August 2016, NGS collected imagery to assist federal, state, and coastal managers in assessing damage from flooding in Louisiana. At the request of the Federal Emergency Management Agency and NOAA’s National Weather Service, NGS collected imagery using coastal mapping and emergency response aircraft, and more than 2,000 images were made available for the public. NGS aerial imagery is a crucial tool to assess the damage to major ports and waterways, coastlines, critical infrastructure, and coastal communities. This imagery provides a cost-effective way to better understand the damage sustained to both property and the environment. NGS concluded topographic bathymetric (‘topo-bathy’) light detection and ranging (lidar) data collection along the outer reef of Florida using the Office of Marine and Aviation Operation’s Twin Otter aircraft equipped with NGS’ newly-acquired Riegl high-resolution nearshore lidar system. Data collected will support nautical charting and will be used by the Florida Keys National Marine Sanctuary for bathymetry maps. NGS produces the national shoreline to provide critical baseline data for updating nautical charts, defining our Nation’s territorial limits, and managing our coastal resources. Additionally, the shoreline supports maritime trade and transportation, coastal engineering and spatial planning, and a multitude of activities for enhancing our global competitiveness and managing our resources.
An accurate, consistent, and up-to-date national shoreline provides data to model sea level change, storm surge, coastal flooding, and pollution trajectories and improves environmental analysis and monitoring.
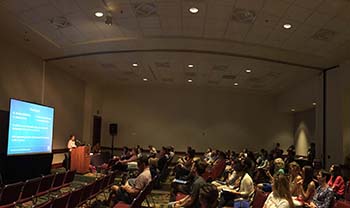
The National Geodetic Survey (NGS) hosted a five-day Airborne Gravimetry for Geodesy Summer School. The school brought experts from around the world to share their knowledge pertaining to airborne gravity data collection and processing techniques and its application to geodesy and geophysics. Sixty-five participants from 12 different countries, including Germany, Spain, and Saudi Arabia, to name a few, took part in the training.
World-renowned subject matter experts from NGS and beyond provided lectures on the overarching theme of airborne gravimetry. Lecture topics covered the history and fundamentals of airborne gravimetry, airborne gravity data collection and processing, geoid modeling using airborne gravity, the emerging developments in airborne gravimetry for geodesy, and time-varying gravity and the geoid.
This free-of-charge educational program covered topics integral to NOAA’s mission and of great interest to the international scientific community. Lecturers provided technical information on conducting measurements of Earth’s gravity field from aircraft and combining that information with other data sources to create the geoid. The school also covered talks on recent advances in gravity measurement technology and aircraft positioning. Presentation materials and recorded lectures from the school are available on the NGS website.
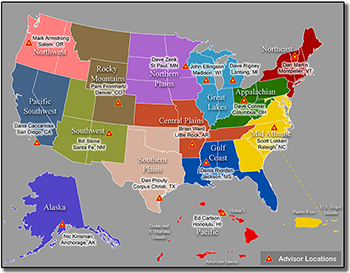
Map depicting the regional advisors and their designated territories.
The National Geodetic Survey (NGS) recently transitioned from a state advisor program, covering only 24 participating states, to our new Regional Advisor Program covering the entire United States. Regional geodetic advisors serve as liaisons between NGS and our public, academic, and private sector constituents within their assigned regions, to ensure all territories are covered.
Regional advisors provide expert guidance to constituents who manage geospatial activities that are tied to the National Spatial Reference System (NSRS). Geodetic advisors serve as subject matter experts on geodetic issues in their region and collaborate internally across NGS and NOAA to further the mission of the organizations. This transition to a regional program is particularly important, as NGS plans to replace the North American Datum of 1983 (NAD 83) and the North American Vertical Datum of 1988 (NAVD 88) by 2022, when our Gravity for the Redefinition of the American Vertical Datum (GRAV-D) project will be completed. During this period of change, every state will need the direct support and technical assistance provided by their regional advisor.
The monthly webinar series now averages more than 130 attendees from across the country each month and has reached over 1,527 participants. Topics presented range from an overview of scientific principles (e.g. terrestrial gravity and space weather) to examples of NGS products and services (e.g. topobathy lidar and VDatum).
NGS has also dramatically increased the accessibility of OPUS Projects training across the country by providing an online delivery option. By expanding the use of OPUS Projects, we enable our customers to conduct survey work more effectively and efficiently.
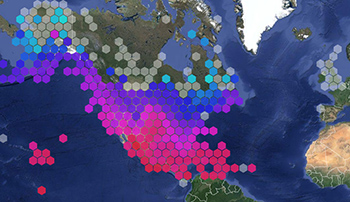
Wide view of the Environmental Sensor Map showing hexagonal bins clustering data points, which can be selected at an individual level when zoomed in.
In FY 2016, U.S. IOOS® launched new tools to expand the availability and discovery of integrated ocean observing data. The IOOS collection page debuted on the Office for Coastal Management’s Digital Coast site. This provides coastal communities quick and easy access to coastal and oceanographic datasets via connectivity to IOOS’s 11 Regional Associations (RAs), which provide observations from areas along the U.S. Coast, Great Lakes, and Pacific territories. Previously only available via individual points of entry, exposing these RA data linkages to Digital Coast users through a single cohesive collection enables quicker and more comprehensive access to national ocean observing resources.
The Environmental Sensor Map displays real-time environmental data collected from over 31,000 stations throughout the world, including the 11 IOOS RAs. The map provides an expansive, integrated visualization of aggregated real-time data, which is useful during storm events where extreme values may display a ‘bulls-eye’ in one area of the nation. This tool accesses and loads an enormous amount of data from myriad observing networks with minimal load time that means more information faster when it’s needed most, at any time.
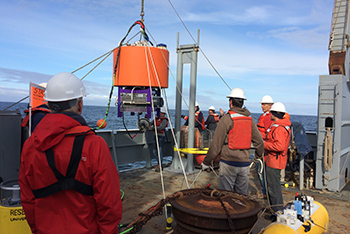
Deploying the Environmental Sensor Processor near the Juan de Fuca eddy in the Pacific Northwest in May, ahead of HAB season. Photo Credit: NOAA/UW
May 2016 saw the deployment of the Environmental Sample Processor (ESP) to monitor and provide early warning for harmful algal blooms (HABs) on the West Coast, following successful deployments in the Gulf of Maine. The Pacific Northwest deployment was undertaken through a U.S. IOOS Ocean Technology Transition project [grant] and led by the University of Washington’s Applied Physics Lab. The ESP—a robotic, marine biosensor developed by the Monterey Bay Aquarium Research Institute (MBARI)—automates sampling and testing and transmits data in near-real time, addressing an accessibility issue that has previously hindered offshore observation. Continuous offshore sampling and data transmission enables earlier detection of HABs, thereby allowing communities and businesses more time to mitigate the impacts.
Originally scheduled for deployment in August 2016, the Washington State Department of Fish and Wildlife and other end-users requested a spring launch following the devastating 2016 West Coast HAB that occurred earlier in the season. A multi-agency team from NOAA (NCCOS & Northwest Fisheries Science Center), IOOS, and the University of Washington came together to make that launch happen, and the new ESP was successfully deployed May 23 on a mooring within the Olympic Coast National Marine Sanctuary near the Juan de Fuca eddy, a known HAB hotspot. The resulting data are the first near-real time ESP observations publically available to end-users in near-real time on the west coast.
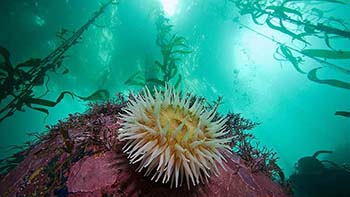
Sea anemone in the kelp beds of Monterey Bay National Marine Sanctuary, one of the sites of the 3 pilot Marine Biodiversity Observing Networks (MBON). Photo Credit: Chad King/MBNMS
The U.S. Marine Biodiversity Observing Network (MBON)--a partnership funded by U.S. IOOS®, NOAA's Office of Ocean Exploration and Research, NASA, and the Bureau of Ocean Energy Management (BOEM) has had a successful second year. Researchers are working toward establishing a long-term national biodiversity monitoring network, through three pilot projects. The projects are working in the Arctic Chukchi Sea, the Santa Barbara Channel, and the Florida Keys, Flower Garden Banks, and Monterey Bay National Marine Sanctuaries. The Arctic Marine Biodiversity Network (AMBON), a partnership with a number of regional initiatives (including the NOAA-led Distributed Biological Observatory), was selected as one of the projects that will support deliverables from the White House Arctic Sciences Ministerial, taking place in fall 2016. The Sanctuaries MBON project extended to include Flower Garden Banks. Work in the Flower Gardens is timely, and MBON researchers are contributing to understanding of the unprecedented coral bleaching event happening there. An increase in availability of time-series data will make this event, and future events, easier to understand and forecast. In the Santa Barbara Channel MBON project, researchers are developing new technology and data handling methods to identify and fill data gaps.
In May 2016, U.S. IOOS® Environmental Data Server (EDS) Model Viewer debuted as part of the IOOS toolkit. The EDS is a data server that harvests, integrates, and displays global, national, and regional model output as well as near real-time environmental observations including the IOOS high-frequency radar network and NOAA resources including CBIBS, CO-OPS, and the National Data Buoy Center. By accessing the EDS via the IOOS viewer, a web-based portal, users can run skill assessments, compare models, and download data from the model source or via the EDS. This model viewer provides access to coastal data for a wide array of applications including marine operations, search and rescue, modeling, and forecasting, expanding the tools and data available to communities, governments, and individuals to make decisions for public health and safety in and around the coasts. Enhancements continue, including additional models, visualization of parameters at different depths, and contour and vector animations within the viewer (now available through a video option). This development and expansion builds on original requirements established by the U.S. Coast Guard, an IOOS contributor, to develop a resource for integrated ocean information to support search and rescue operations.
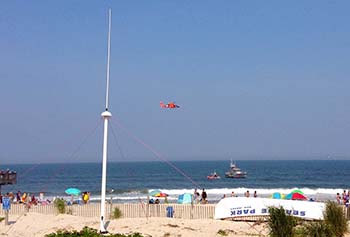
High Frequency radar dome antenna array on the beach. Radars such as these provide communities, industry, and the weather service with surface current information, vital for forecasting open ocean conditions.
In February 2016, U.S. IOOS® released The Ocean Enterprise: A study of U.S. business activity in ocean measurement, observation and forecasting. This study is the first national-level assessment of private sector activity in this critical component of the blue economy, which helps deliver critical safety, economic, and environmental benefits across the board, advancing maritime commerce. Commercial and non-profit activity in this sector has not previously been examined as a stand-alone sector as it is scattered among numerous economic activities. By collecting this information into a single analysis, NOAA and other entities are better able to see opportunities for partnerships and innovation, as well as identifying information gaps. Key findings include that this private sector activity contributes USD $7 billion to the US economy annually and that 85% of businesses surveyed expect to expand going ahead, indicating that there are opportunities for successful public/private partnerships to improve public health and safety.
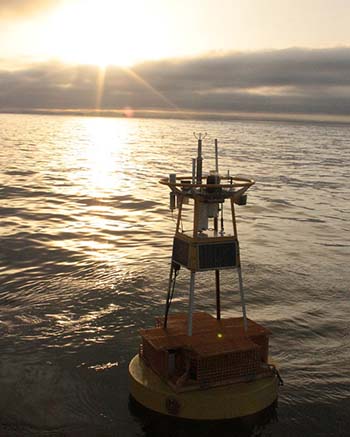
"Chá ba," a buoy off the coast of Washington, contributes better information about the ocean conditions that oysters can and cannot tolerate. Photo credit: NANOOS
In FY 2016, U.S. IOOS® and the National Weather Service completed work to integrate high-frequency radar-derived surface current data into the powerful data processing tool AWIPS-II (the Advanced Weather Interactive Processing System), giving Weather Forecast Offices (WFOs) in coastal areas new access to ocean data that directly impacts their service areas. IOOS operates the nation’s only high-frequency radar network, providing near-real time 2-D maps of ocean of surface currents speed and direction. This network supports U.S. Coast Guard search and rescue operations, NOAA response to oil spills, port navigation, tracking of harmful algal blooms, and now offers WFOs more insight into offshore and coastal storm movement, storm surge events, and wind movement.
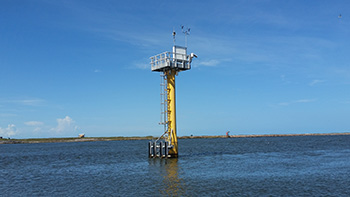
NWLON station specially reinforced to withstand hurricanes and other major storm events. Reinforced stations are better able to keep functioning during these events, providing critical information on water levels and winds that aids emergency response organizations
The Center for Operational Oceanographic Products and Services (CO-OPS) added four new water level stations in the Gulf that are specially reinforced to withstand hurricanes and other major storm events. The reinforced stations are better able to keep functioning during these events, providing critical information on water levels, winds and other meteorological information that can aid emergency response organizations. This was made possible through CO-OPS’ partnership with the Army Corps of Engineers in Galveston, Texas.
William Ferrel and Rollin Harris of the U.S. Coast and Geodetic Survey introduced the Maxima and Minima Tide Predictor, seen here, which began making predictions in 1885
The Center for Operational Oceanographic Products and Services (CO-OPS) completed the 2016 Tide Tables and Tidal Current Tables, which marks the 150th edition since NOAA began publishing them. These predictions are the cornerstone of the services NOAA provides the nation. They provide information for safe navigation for mariners, inform climate change research, help coastal communities understand when they may experience high or low water, and help commercial and recreational fishermen improve their catches. The Coast and Geodetic Survey, NOAA’s predecessor, published the first edition in December 1866 for the year 1867. The manuscripts have been shipped to publishers, and should be available in a few weeks.
Events like severe storms, floods, tsunamis, or maritime disasters can all result in a large influx of debris in coastal areas
The NOAA Marine Debris Program completed the Florida Incident Waterway Debris Response Guide in 2016 to improve preparedness for response to and recovery from events like severe storms, floods, tsunamis, or maritime disasters that can result in a large influx of marine debris. This guide is the second completed in an ongoing effort by the NOAA Marine Debris Program to collaborate with local, state, and federal entities in coastal states in developing state-specific guidance documents for easy reference in the case of a severe marine debris event. The Florida Guide serves as a comprehensive reference for incident waterway debris response. It contains an outline of existing response structures and captures all relevant responsibilities and existing procedures in Florida. The guide is accompanied by a Field Reference Guide with pertinent quick reference information for in the field emergency response operations.
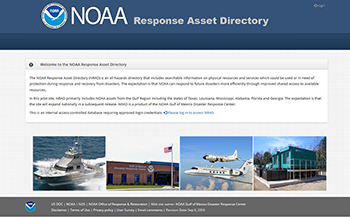
With the implementation of the NOAA Response Asset Directory, NOAA will be better positioned to respond to future disasters efficiently through improved shared knowledge and access to available resources for all NOAA staff
NOAA’s Gulf of Mexico Disaster Response Center (DRC) - housed in the Office of Response and Restoration - takes a leadership role in building NOAA’s preparedness and ability to respond to and mitigate environmental impacts from natural and human-caused disasters such as hurricanes and major oils spills. As part of the National Ocean Service Roadmap resilience and response strategies, an online NOAA Response Asset Directory (NRAD) was developed. The NRAD is an all-hazards resource directory that includes searchable and spatial information on physical resources, as well as NOAA services which could be used or in need of protection during response and recovery from disasters.
The pilot project has been completed for six states at high risk for hurricane threats - Texas, Louisiana, Mississippi, Alabama, Florida, and Georgia. Initial responses highlight the application as a very powerful planning, response, and incident recovery tool, and the expectation is that the directory will expand nationally over the next year. With the implementation of the NRAD, NOAA will be better positioned to respond to future disasters efficiently through improved shared knowledge and access to available resources for all NOAA staff.
Offshore aquaculture is a promising new frontier for U.S seafood production. However, the growth of this industry has been constrained by concerns about negative environmental effects of improperly sited farms. In response, NCCOS and NOAA’s Office of Coastal Management partnered to develop a new, offshore aquaculture planning tool, CanVis. This seascape visualization tool contains an image library of aquaculture gear, vessels, buoys, and other infrastructure that can be used to simulate the changes that result from aquaculture development. Coastal managers and developers in Hawaii, California, and Washington are currently using this tool to visualize and plan offshore aquaculture projects.
In 2016, NCCOS demonstrated that oyster aquaculture can improve water quality as well as meet the demand for seafood. Oysters are filter feeders that remove nutrients from the water. Working with partners, we combined models on shellfish growth and nitrogen removal to determine the nitrogen removal potential of Long Island Sound’s existing and potential oyster aquaculture industry. Using economic analysis to determine the value of the ecosystem service provided by the oyster aquaculture industry, we found that both the cost and removal efficiency of nitrogen through shellfish aquaculture compare favorably to removal by existing agricultural and stormwater Best Management Practices. Also in 2016, NCCOS initiated similar projects in the Chesapeake Bay and Oyster Bay, Florida.
Scientists at the Sitka Tribe of Alaska Environmental Regulatory Laboratory use NCCOS-developed assay to detect paralytic shellfish toxins
NCCOS continues to improve the nation’s ability to forecast, detect, and mitigate the impacts of harmful algal blooms (HABs). In 2016, we identified the most pressing science needs in the Harmful Algal Blooms and Hypoxia Comprehensive Research Plan and Action Strategy, an interagency report co-authored by NCCOS and delivered to Congress.
NCCOS and its partners deliver HAB forecasts for Lake Erie, the Gulf of Maine, and the Gulf of Mexico. This year, the team improved the early season projections for Lake Erie (first tried in 2015) by adding a Maumee River flow forecast model from the National Weather Service. This model substantially reduced the uncertainty of those projections, which began almost two months prior to the final seasonal forecast. We also established an initial operating capability at NOAA’s Center for Operational Oceanographic Products and Services for production of the twice-weekly Lake Erie HAB bulletin. Final operating capability will be established next year.
In Alaska, NCCOS scientists trained staff at the Sitka Tribe of Alaska Environmental Regulatory Laboratory on the extraction and detection of paralytic shellfish toxins. The NCCOS-developed assay taught is a new method recently accepted by the Interstate Shellfish Sanitation Conference that can help secure the food supply against these potent algal-based toxins.
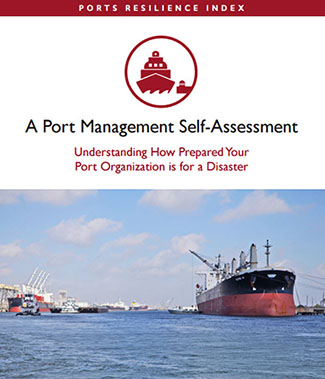
The Ports Resilience index is a user-friendly tool for maintaining port and marine transportation operations during and after disasters
Ports play an important role in waterfront community resilience. A new tool, the Ports Resilience Index, is a simple and inexpensive means of undertaking a readiness assessment for maintaining port and marine transportation operations during and after disasters.
Ports that have completed this self-assessment include the Port of Corpus Christi Authority in Texas, the Jackson County Port Authority Mississippi, the Port of Lake Charles Harbor and Terminal District in Louisiana, and Port Tampa Bay in Florida. The Office for Coastal Management funded this project, which was a partnership effort led by the Gulf of Mexico Alliance and coordinated by the Louisiana Sea Grant. Other partners included Mississippi-Alabama Sea Grant, Dewberry, seven Gulf of Mexico ports, the Gulf Ports Association of the Americas, and industry partners. The nation’s seaports move over $1.5 trillion in cargo each year, supporting port-side employment of more than 420,000 persons that pays $30 billion in wages each year. Keeping ports safe (and working) represents an important aspect of the nation’s economic health.
Infographic showing application and benefits of green infrastructure
Green infrastructure, the use of nature-based solutions to minimize flooding, is gaining traction throughout the coastal zone. NOAA’s Office for Coastal Management provided funding ($410,000) and assistance to develop an information tool that is guiding green infrastructure investments in Staten Island and Jamaica Bay. The tool incorporates research on green infrastructure performance during Post-Tropical Cyclone Sandy, and integrates data on future flooding scenarios, vulnerable populations, and critical infrastructure. The tool is being used by The Trust for Public Land and the City of New York to identify the most suitable and effective green infrastructure investment locations, as they made decisions about the best way to use the $176 million in disaster resilience funds New York received from the U.S. Department of Housing and Urban Development.
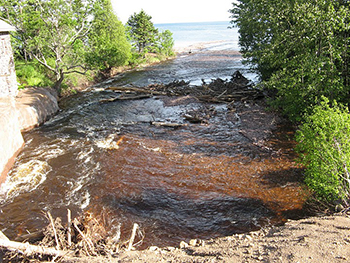
Heavy precipitation event caused riverine flooding, and erosion and runoff into Lake Superior in 2008
Wisconsin and Minnesota are working together to make coastal communities safer. Recent Wisconsin legislation requires coastal communities to create resilience plans, and the state identified green infrastructure (nature-based approaches) as a viable alternative to seawalls and other built structures. The Lake Superior National Estuarine Research Reserve provided scientific research and expertise, and helped create the partnerships communities needed to successfully apply for funding assistance. One of these partners was the city of Duluth, Minnesota, as this city was also seeking green infrastructure solutions. The reserve used both social and natural science to provide the information needed, and the two states developed a successful joint application for a NOAA-funded project.
This year, the NOAA Coral Reef Conservation Program completed a science evaluation to gain a better understanding of how the data, tools and products it provides are used by stakeholders. A panel of leading, independent coral reef experts investigated the accessibility of the information to coral reef managers and policy makers, how helpful these products are for coastal management decision makers, and how the data, information, and services are being used to support coral reef conservation. This review covered NOAA Coral Reef Conservation Program-funded ecosystem science only. Reports from the panelists and the program’s response, including an action plan for program adjustments based on panelists' recommendations, are available on the program’s web site.
NOAA’s coral reef research portfolio was well represented at the 13th International Coral Reef Symposium in Honolulu Hawaii
NOAA’s coral reef research portfolio was well represented at the 13th International Coral Reef Symposium (ICRS) in Honolulu Hawaii with researchers joining sessions and media events on the conservation, restoration, policy, and science of coral reef and associated habitats. ICRS organizers also hosted a Leader’s Summit with the presidents of the Federated States of Micronesia, Palau and Republic of the Marshall Islands. These leaders issued a call to action requesting increased collaboration between the scientific community and local governments, acknowledging there needs to be more funding and a strengthened commitment to protecting coral reefs. ICRS is the largest international meeting focused on coral reef science and management. It was hosted by the International Society for Reef Studies and was sponsored by the NOAA Coral Reef Conservation Program. The symposium takes place every four years.
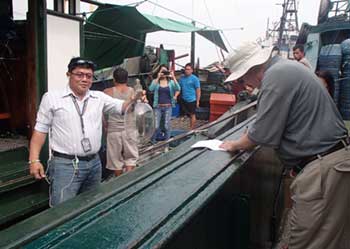
A NOAA scientist works with the Philippines Bureau of Fisheries and Aquatic Resources to ground truth light signatures of fishing lights detected using visible infrared imaging technology.
2016 marked the third year of a $20 million dollar partnership between NOAA and the USAID Regional Development Mission for Asia to strengthen local marine conservation in an area with some of the planet’s most diverse marine habitats. NOAA provided trainings on:
Ecosystem approaches to fisheries management in the Philippines,
Marine protected area management in the Philippines and Indonesia,
Development of sustainable marine tourism in Indonesia, and
Methods and technologies, like visible infrared imaging, to enhance marine enforcement in the Philippines and Indonesia.
The NOAA Coral Reef Conservation Program coordinates the agency’s engagement in international coral reef issues. NOS, NMFS, OAR, and NESDIS play a key role in implementing the trainings that are core parts of this five-year partnership with USAID.
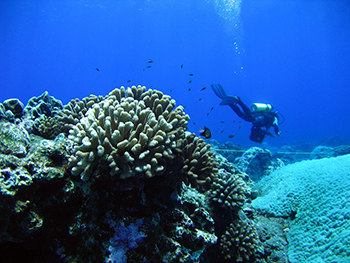
A diver collects data on the condition of coral reefs in the Mariana Islands
Scientists collected biological, climatic, and socioeconomic data in 2016 to measure changes in U.S. coral reef ecosystems as part of the National Coral Reef Monitoring Program. In the Hawaiian Archipelago, NOAA scientists conducted hundreds of fish and benthic surveys and recovered and re-deployed instruments to assess impacts of ocean acidification and warming. In the Atlantic, scientists gathered similar data at sites in Puerto Rico and Florida. Social science researchers focused on the connections between coral reef ecosystems and people, their communities and economies by completing resident surveys in Guam and the Northern Marianas Islands. Satellite remote sensing provided data across all U.S. reef areas, filling gaps between field sampling sites. The National Coral Reef Monitoring Program is an integrated and focused monitoring effort with partners across the U.S. and its territories. Outcomes will help managers, decision makers, and communities better understand the condition of their resources and take effective place-based conservation actions.
Map showing the expanded area of Papahānaumokuākea Marine National Monument. The new boundary extends out to the U.S. EEZ (shown in purple). The monument's original area is shown in blue
On August 26, 2016, President Obama signed a proclamation expanding Papahānaumokuākea Marine National Monument. Previously the largest contiguous fully-protected conservation area in the United States at 139,797 square miles (362,073 km2), the expanded boundaries make it once again the biggest protected area on the planet at 582,578 square miles (1,508,870 km2), nearly the size of the Gulf of Mexico. Papahānaumokuākea is globally recognized for its biological and cultural significance, being the only mixed UNESCO World Heritage site in the United States and only one of 35 mixed sites in the world. This expansion not only provides direct protection to this global resource, but also brings critical attention to the need for increased ocean conservation and protection worldwide. Despite its remote location in the Northwestern Hawaiian Islands, PMNM faces a looming threat of global climate change that will affect its land and marine ecosystems, as well as its cultural resources -- a threat that ocean resources are facing across the globe.
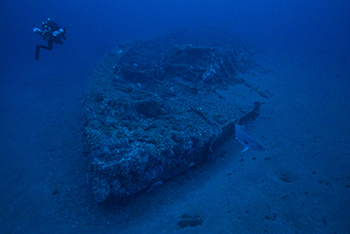
USS Monitor. This famed Civil War ironclad sank during a storm on December 31, 1862, and wasn't found again until 1973. Its discovery prompted the creation of our first national marine sanctuary, Monitor National Marine Sanctuary! Photo Credit: NOAA Monitor Collection
For more than 40 years, Monitor National Marine Sanctuary has served as a special place honoring the iconic Civil War ironclad, USS Monitor, and the memory and service of Civil War sailors. The proposed expansion, announced in January 2016, is an opportunity to honor another generation of mariners that helped defend the nation during both World Wars. An expansion of this historical site just off of North Carolina’s coast would protect a collection of historically significant shipwrecks vessels, including vessels sunk during World War II’s Battle of the Atlantic.
Building on more than 30 years of scientific studies, including numerous reports released in the last decade and in the aftermath of the 2010 Deepwater Horizon oil spill, NOAA announced in June 2016 to expand Flower Garden Bank National Marine Sanctuary. The preferred scenario would cover an extra 383 square miles, including 15 reefs and banks that provide habitat for recreationally and commercially important fish, as well as 15 threatened or endangered species of whales, sea turtles, and corals. This scenario also calls for comprehensive management and protection of these important habitat sites and cultural resources, and would provide more opportunities for research and recovery of resources.
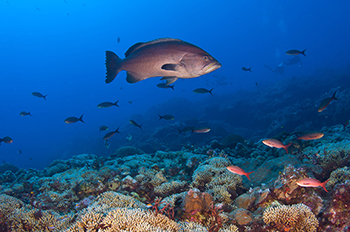
Red grouper and boulder star coral photographed in the Upper Keys, at Florida Keys National Marine Sanctuary
Less than a hundred miles south of the reefs and mangrove forests of Florida Keys National Marine Sanctuary are the marine ecosystems of our neighboring nation, Cuba. In November 2015, a Memorandum of Understanding (MOU) was signed by NOAA, the National Park Service, and Cuba’s Ministry of Science, Technology, and Environment. This new MOU includes the establishment of sister-sanctuary relationships between Guanahacabibes National Park in Cuba, including its offshore Bank of San Antonio, and Florida Keys and Flower Garden Banks national marine sanctuaries in the United States.
Recognizing that these protected areas are all inextricably linked by ocean currents and animal migrations, and threatened by some of the same environmental stressors (such as ocean acidification), this MOU is an opportunity for marine protected area managers and scientists in the U.S. and Cuba to learn from one another’s experiences, benefiting and improving the health of coral reef resources in both countries.
The U.S. has identified advancing marine protected areas (MPA) networks as a priority under its chairmanship of the Arctic Council during 2015-2017. The Arctic is experiencing rapid changes due to climate impacts, including receding sea ice which will open sensitive ecosystems to human uses. While MPAs are effective marine conservation tools, many stakeholders in Alaska are concerned about potential restrictions on access to ocean resources. To provide an opportunity for dialogue and consensus building on this issue, NOAA and the Department of the Interior asked the MPA Federal Advisory Committee to develop guidance on MPAs and MPA networks in the Arctic. The “Guiding Principles for Marine Protected Areas and MPA Networks in the Arctic” were developed by the Committee’s Arctic MPA Working Group, representing diverse U.S. Arctic stakeholders. The “Guiding Principles” note the impacts and implications of climate change already being felt, the role of MPAs as a conservation tool, and strongly emphasize the importance of engagement with Alaska Natives and local stakeholders.
The inaugural issue of Earth is Blue: Magazine of the National Marine Sanctuaries was released in June 2016. Following on the footsteps of ONMS’ social media campaign Earth is Blue, the magazine covers a broad range of topics and everything that the sanctuary system has to offer. The beauty and economic benefits of our country’s underwater parks are highlighted through mesmerizing photographs and stories. Expect to learn about our nation’s indigenous cultures, maritime heritage, conservation of vital marine areas and the wide variety of recreational activities that visitors can enjoy responsibly. The Earth is Blue: Magazine of the National Marine Sanctuaries is available in hard copy and online.
In FY16 NOAA’s Planet Stewards Education Project (PSEP) grew to 950 formal and informal educators and engaged over 2,230 educators in monthly webinars and seven face-to-face workshops held in Boulder, CO, New Orleans, LA, Salt Lake City, UT, Detroit, MI, Charleston, SC, Long Beach, CA, and at the National Science Teachers Association national conference in Nashville, TN. These in-service opportunities focused on the regional impacts of climate change, hands-on education activities, and exploration of technologies and innovations in Earth-system science. Webinars and workshops were given by nationally recognized climate scientists, educators and communicators, and attendees learned about sea level rise, impacts to fisheries and habitats, using models to teach climate change, framing conversations about climate change, severe weather, coastal resilience, water resources, and climate games. Post webinar and workshop evaluations showed that 98% of all attendees learned from their experiences and 94% planned to use what they learned in their work over the next year, sharing the information and resources they received with over 82,645 colleagues, youth and adults.
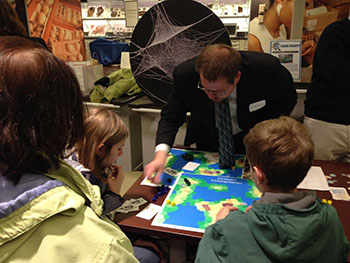
Groups of students and teachers playtest climate games at the Smithsonian Museum of Natural History
As part of the Climate Education and Literacy Initiative (OSTP) NOS sponsored two National Climate Game Jams in FY16 through a network of federal agencies, universities, schools and informal institutions. Students in grades 5-16 and adults were challenged to develop game prototypes related to the impacts of climate change. Kickoff events at the White House and at the California Academy of Science on October 2 challenged the participants at 11 locations to develop engaging digital and analog games for many ages. 30 games were developed over the 48-hour time period and submitted for judging by game and climate experts. Winners were invited to the National Museum of Natural History to showcase and playtest their designs. Prototype ideas included a role-playing game that put the player in the position of a coral farmer working to restore a damaged coral reef, a board game that challenges players to manage resources, and a habitat game about how migration forced by climate change affects territorial interactions of owls. A second game jam was held April 16 - 24, 2016 at 9 sites, resulting in17 game submissions focused on the unique challenges climate will bring to water resources. Game jams offer students and adults opportunities to interact with climate and game experts to learn about the impacts of climate change and resilience through science-based experiences.
NOS priorities depend on rapid access to essential information. In support of all NOS priorities, NOS IT has committed to an enterprise cloud* strategy and presence. Cloud computing promotes faster product delivery and access to data at a more efficient cost. ORR has hosted ERMA and DIVER in the cloud since 2014 for ensured access and availability. In FY15 and FY16, NGS improved response time by over 50% and achieved annual cost savings of $40,000 by delivering emergency response imagery from the cloud.
NOS further established its cloud presence in FY16: NCCOS migrated scientific information and tools, and is processing proto-type scientific data models in hours compared to the months consumed by traditional computing resources. OCS migrated its IOCM website for improved content management and availability. CO-OPS deployed a Continuity of Operations development site, with plans to establish improved failover resilience capability. OCM is moving 50TB of data to back up production level geospatial data. ONMS cloud plans will move them away from geographically at-risk localized hardware-based solutions. IMO sponsors resources for cloud coordination and administration and is extending on-premises infrastructure to support secure cloud operations. NOS led the effort to deploy the first ever NOAA-wide cloud-based GIS helpdesk system.
NOS uses its online presence to reach the ocean-interested public. Traffic to the NOS website increased 38% during FY 2016 compared to FY 2015; monthly website traffic peaked at an all-time high 2.4 million visits in May, 2016. The number of Facebook “likes” grew more than 57% (from 64,413 to 101,262) and the number of Twitter followers grew more than 13% (from 129,480 to 146,820). During its 30-day National Ocean Month campaign, NOS reached more than 1.4 million users on Facebook. Also in FY 2016, NOS completed several Reddit 'Ask Us Anything' sessions featuring NOS scientists. The AUA on Harmful Algal Blooms reached an estimated 10.36 million people and included more than 180 questions. NOS launched its Instagram in June 2015, which closed out FY 2016 with 13,060 followers.
 An official website of the United States government.
Here's how you know we're official.
An official website of the United States government.
Here's how you know we're official.