Officials from Cuba’s charting agency traveled to Maryland and met with National Ocean Service representatives in December 2015, as the agencies began to formulate the memorandum of understanding on cooperation to improve maritime navigation safety and related areas of mutual interest – to protect lives and property at sea. The countries signed the MOU in Havana on March 18, 2016.
NOAA's navigation services office's (CO-OPS,IOOS, NGS, OCS) directors and subject experts traveled to Havana to meet with their counterparts in Cuba's National Office of Hydrography and Geography. The U.S. and Cuba have expressed their joint commitment to pursuing the improvement of maritime safety through the exchange of modern hydrographic data and products. A Memorandum of Understanding (MOU) was signed in March 2016 to improve maritime navigation safety and related areas of mutual interest to protect lives and property at sea. In the MOU, both agencies agreed to "develop annual work plans to identify specific priority activities for cooperation." Among a range of activities, the U.S. looks forward to coordinating electronic navigational charts production and facilitating international charts; improving tides and currents monitoring and forecasting; and collaborating on geodetic challenges. This agreement is the first step in what is expected to be a long-term collaboration between the two countries.
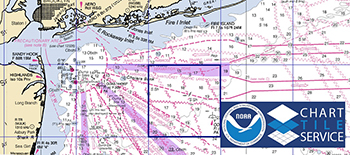
Coast Survey has created millions of tiles, covering over a thousand NOAA raster navigational charts, so electronic charting systems and apps can use the smaller tile files to speed updates to users.
In recent years, larger manufacturers have switched to using NOAA raster charts but experienced problems with downloading NOAA’s huge chart files that take a long time to upload. In response, NOAA’s Office of Coast Survey collaborated with the navigation electronics industry to create new chart tile products and services to alleviate this problem. The new service provides digital chart users with faster and easier updates. The first phase, completed in December 2015, allowed commercial users to update their charts by accessing tiles (sections of nautical charts) online. The final phase packages tile sets within geographic regions for offline use. Users like recreational boaters are now able to download geographic packages that are updated weekly and contain only those tiles that have changed since the last full package. This dramatically reduces the bandwidth requirements necessary to keep a vessel’s chart suite up to date.
Cartographers and hydrographers from twelve countries gathered in Maryland this past July to participate in a three-day NOAA workshop on evaluating the adequacy nautical charts. During the workshop, they learned techniques to evaluate the suitability of nautical chart products using chart quality information and publicly available information. The participants then generated key layers in adequacy assessments such as: 1) using automatic identification systems (AIS) information to classify navigational routes; 2) comparing satellite-derived bathymetry or other surveys of opportunity with the existing chart, to identify areas that showed significant bathymetric changes; and 3) classifying chart quality information.
By involving the guest cartographers and hydrographers in hands-on layer development and use, instructors demonstrated that the procedure is a low-cost tool that can help any hydrographic office assess the adequacy of its charts. Participants came from Barbados, Brazil, Canada, Japan, Malaysia, Pakistan, Peru, Russia, Vietnam, Netherlands, Mexico, and Thailand.
Small survey vessel deploys from NOAA Ship Thomas Jefferson to acquire navigational chart update data off the coast of Virginia
NOAA began a gradual rollout of a new nautical chart feature called the zone of confidence or ZOC box. Since charts are generally made up of data collected throughout the last century or longer ago, the ZOC tells the chart user when data were collected for specific portions of the chart, allowing the mariner to evaluate the risk level of navigating the area. As an example, the ZOC tells mariners if they are navigating in an area using data from the era of Captain Cook (circa 1778), data acquired by modern sonar, or something in between. The mariner is now better able to assess the chart’s reliability. The new ZOC classifications are derived more consistently, using a combination of survey data, position accuracy, depth accuracy, and seafloor coverage. NOAA nautical charts, mandated by statute, provide the coastal intelligence necessary for safe and efficient navigation.
The Hurricane Surge On-demand Forecast System (HSOFS) was successfully implemented for operational use on NCEP Central Operations’ high performance computing system. The model grid and testing was originally developed in a project with AECOM and Riverside Technology, Inc., and further testing and transition to operations was coordinated through the Coast Survey Development Laboratory’s Storm Surge Team. HSOFS is a hurricane storm surge forecast system based on ADvanced CIRCulation (ADCIRC), an advanced, large-scale storm surge model with local high resolution to predict flooding in coastal communities. HSOFS simulates water levels as hurricanes track across the Western Atlantic Ocean and Gulf of Mexico, and covers the coast from Texas to Maine including Puerto Rico and the U.S. Virgin Islands. Each operational run of HSOFS includes an ensemble of five simulations in which modifications are made to the National Hurricane Center’s (NHC) Forecast Advisory track (official, right shift, left shift, more/less intense). Operational implementation of HSOFS is intended to be used near the time of hurricane landfall to provide additional guidance to the NHC.
 An official website of the United States government.
Here's how you know we're official.
An official website of the United States government.
Here's how you know we're official.