
Students will revisit the Big Question posed at the start of the module: “How do Individuals, communities or governments ensure that there is enough seafood for people to eat in the future? They will look at projections from a model of future lobster biomass and determine their level of confidence in those projections based on what they’ve learned about model validation. They will also look at biomass projections from models for another common food source, tuna. Finally, students will observe the large impacts that human activities, in this case fishing, have on populations of marine organisms.
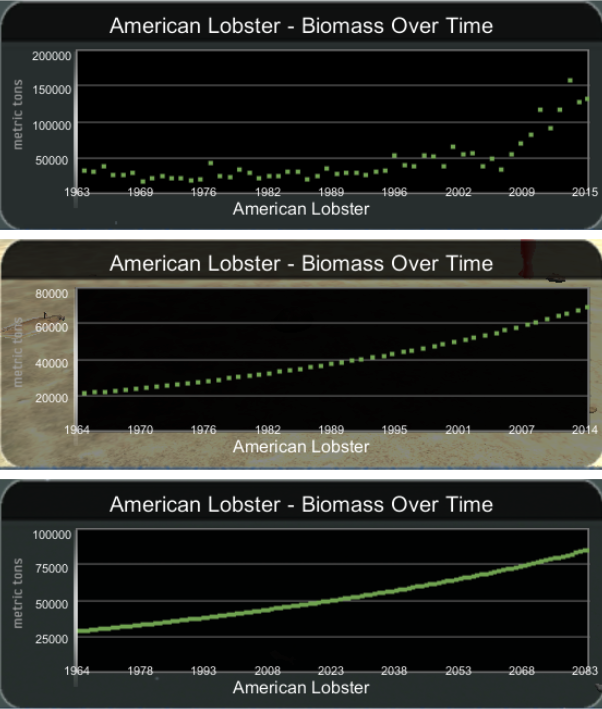
Have your students review the graphs of lobster biomass from observations and from two different models (Figure 13). They should notice that the third graph includes long-term model projections extending to the year 2083. Over that timespan lobster biomass roughly triples.
NOTE: The three graphs don’t match precisely over the ranges of years where they overlap, but they all show a significant upward trend over time. Remind your students of the degree of difference between observations and model-based data in the model validation activity. Although one dataset exhibited a tripling of biomass while the other indicated just a doubling, the two datasets agreed that lobster biomass was increasing substantially. Likewise, actual lobster biomass in the future will likely deviate a fair amount from the model’s projections.
It also seems likely however, based on the model validation activity, that the long-term biomass for lobsters should increase significantly, even though that increase might be a bit more or less than the predicted tripling. Overall, the biomass of lobsters seems likely to rise over time. Students should realize, based on these projections and their level of confidence in the model, that future supplies of lobster for seafood should be adequate for human consumption.

Figure 13: Lobster Biomass from Observations (Top) and Models (Middle and Bottom)
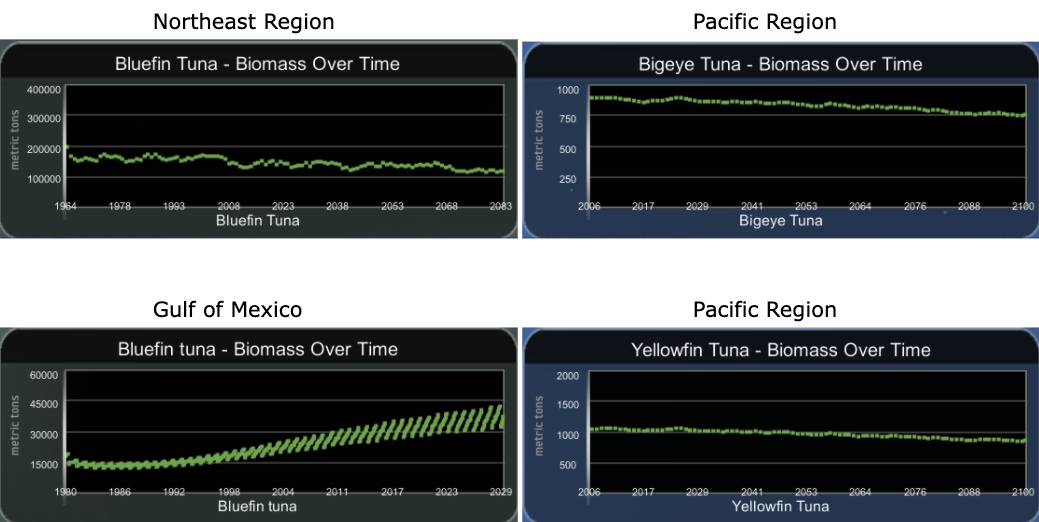
Next, remind your students that tuna fish is another source of seafood that many people eat. Show students Figure 14, which displays tuna biomass data from models used in VES-V for four different cases. The data comes from different regions; tuna are found in the Gulf of Mexico, the Northeast, and in the Pacific. Ask your students what overall story about the future of tuna availability these model-based datasets predict.

Figure 14: Tuna Biomass Data from the Northeast, Gulf of Mexico, and Pacific Regions
NOTE: Students should notice that the situation regarding future tuna populations is less clear-cut than was the case for lobsters. The projection for the tuna population in the Gulf of Mexico shows a moderate increase, roughly doubling in the 50-year span of the graph. However, the projections for the Northeast and Pacific show slight decreases in tuna biomass over the years. Remind your students that the match between model-based projections and actual observations of lobster biomass was not exact, and that they should not expect that the projections for tuna biomass will precisely match the actual future biomass. Since the projected declines in tuna biomass in the Northeast and Pacific are slight, the difference between model projections and actual future tuna biomass could mean that biomass actually increases slightly, or stays about the same, or even decreases a moderate amount. Students may notice that estimates of the future biomass of tuna do not provide a high degree of confidence about the trend in tuna populations. In general it is too hard to tell from these projections whether tuna biomass will increase, decrease, or stay about the same. However, these model results may be helpful to fisheries managers as they provide guidance for future tuna harvest policies.
Next, let your students know that models are sometimes run with different assumptions about future conditions. Some models designed to predict the influence of climate change include warming water temperature or lower pH (ocean acidification) in their calculations. Other models (often referred to as “baseline models”) do not change any conditions from the current situation.
In many cases, the amount of fishing conducted by humans has a large influence on the biomass of marine organisms. Some models are designed to compare situations of increased or decreased fishing with the baseline scenario.
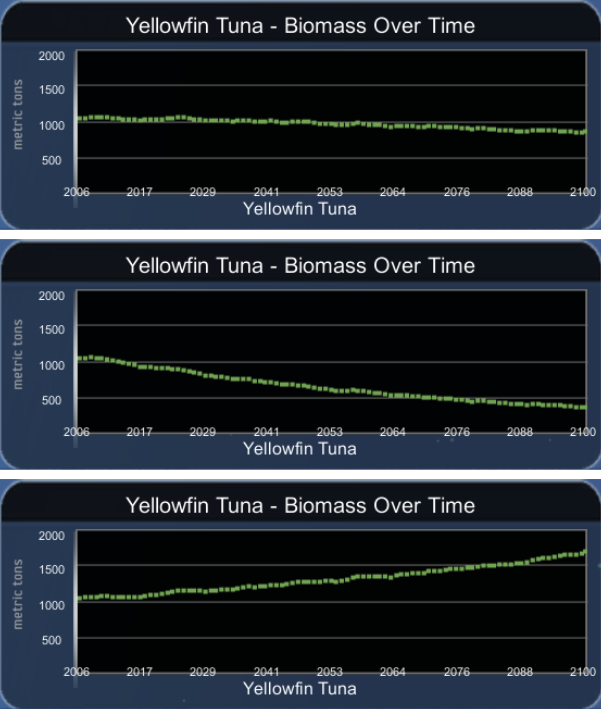
Figure 15 includes projections for Yellowfin Tuna biomass in the Pacific region for three model scenarios: the baseline case, increased fishing, and decreased fishing.

Figure 15: Pacific Tuna Biomass - Baseline, More Fishing, Less Fishing (Top to Bottom)
Discussion: Students should easily notice that although tuna biomass is mostly unchanged over the course of the baseline scenario, the increased fishing scenario produces a significant decline in tuna biomass, while the decreased fishing scenario produces a marked rise in tuna biomass.
Discuss how people who manage fisheries sometimes limit the amount of fish that commercial fishing boats are allowed to catch in a season if fish stocks are low. Such limits can allow fish populations to rise, returning to a level that supports more sustainable fishing.
Complete the activity by discussing the various areas where models are useful. Examples include the study of weather and climate, assessments of population and resources, and business and economics.