
Students will construct a simple model to estimate the temperature in a fictional town (Middleton) that is located halfway between two other fictional towns (Warmville and Coolville) where the temperature is known. Students should realize that due to geographic influences, the temperature in Middleton should be more akin to the temperature in Coolville.
We recommend you use the presentation graphics with the images noted below to illustrate the concepts being discussed
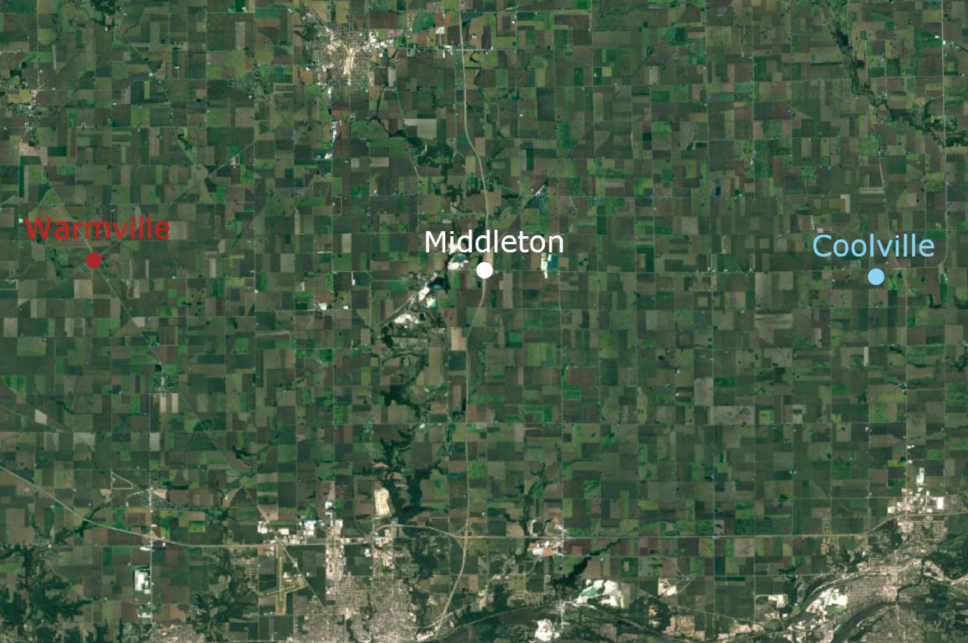
Show students Figure 1, the map of the three towns at an inland location. Let them know that the temperature in Coolville is 10° C (50° F). At the same time, the temperature in Warmville is 20° C (68° F). Ask students to estimate the temperature in Middleton. Simple interpolation gives a temperature of 15° C (59° F), halfway between the values in Warmville and Coolville. Middleton is midway between the other two towns, and there aren’t any obvious geographic or other considerations that would affect the temperature in Middleton. Tell students to record their temperature estimate for the inland version of Middleton in the table on “VES-V Observations & Model Data Lesson Worksheet #1: Estimated Temperature (inland and coastal)”.

Figure 1: Inland Map of Three Towns
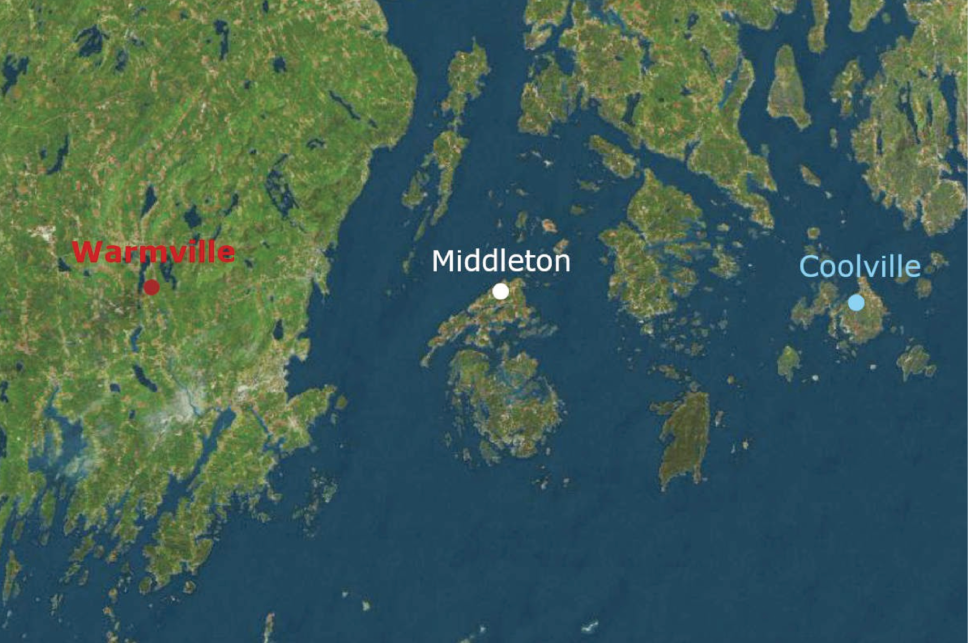
Next, show students Figure 2, the map of the three towns at a coastal location. Once again, the temperature in Coolville is 10° C (50° F) and in Warmville it is 20° C (68° F). Ask the students to again estimate the temperature in Middleton and record their estimate in the table on “VES-V Observations & Model Data Lesson Worksheet #1: Estimated Temperature (inland and coastal)”.
NOTE: In this case, although Middleton is again halfway between the two other towns, its setting is much more like the location of Coolville. Based on this geographic setting, students should expect the temperature in Middleton to be closer to the temperature in Coolville than the half-way-in-between value in the previous example. The precise values of student estimates for the temperature in Middleton are not crucial. They should fall in a range somewhere between about 11° and 14° C, or 51° 58° if you are using the Fahrenheit scale. The key idea is that the temperature in Middleton should be cooler than the midway, interpolated value of 15° C (59° F); and warmer than the temperature in Coolville of 10° C (50° F).

Figure 2: Coastal Map of Three Towns
Discussion: Review with your students how they have created two simple models for the temperature in Middleton. In the first case, the model was based on simple interpolation. In the second, coastal case the model also included assumptions based on the geographic settings of the three towns.