
Students will compare observational data about the biomass of a marine organism with model-based data for the same creature over a similar time span. Then they will check the validity of the model and how well it matches with actual observations. If the model’s validity is high, it can be used with confidence to predict future biomass levels.
Inform your students that they will examine the validity of a model dataset in VES-V by comparing it to an observational dataset that covers an overlapping timespan. They will remain in the same habitat they just explored (Northeast, Gulf of Maine, sand flats).
Remind them of the goal of predicting future population levels of fish and other creatures that people eat, and that they can have more confidence in the future predictions of a model if that model has been validated by comparing it with observations over some time period e.g. the model they made for the temperature between Hawaiian islands, and how they validated that model by comparing observations from the buoy.
Like the Baseline scenario used in Activity VI, have your students conduct a “virtual dive” to the same region and habitat (Northeast, Gulf of Maine, sand flats), and ask them to load the NEFSCsurveytrawlandMammalBird scenario dataset that they used in the activity VI. Remind them that this data comes from observations.
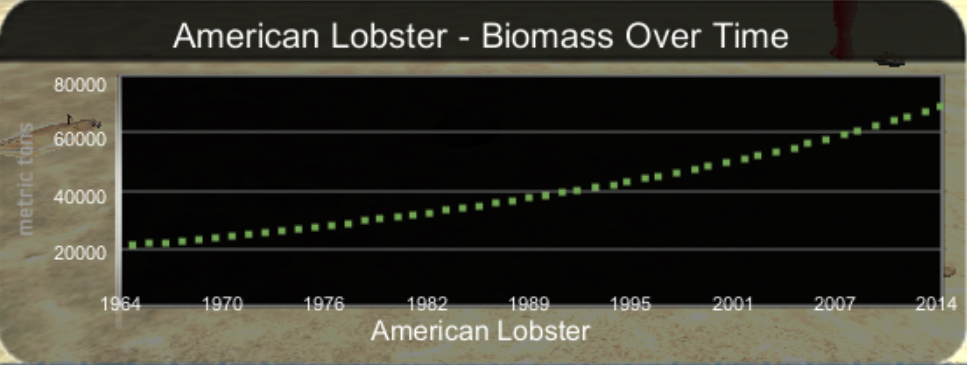
Ask your students to view the biomass graph for American lobster. Remind them that lobster is a commercially important source of seafood. Have them record the lobster biomass data from two specific years, 1970 and 2002, in the table on “VES-V Observations & Model Data Lesson Worksheet #5: Model Validation: Lobster Biomass”.
NOTE: These specific years were chosen because they are fairly easy to find on the time axis of the graph, and the biomass values don’t fluctuate too much around those years, making it easier for students to estimate values.
Next, ask your students to collect data from the VES-V about lobster biomass for the same years, but now using data created by a model. Tell them to use the “SCN” (scenario) icon in the upper left corner of the VES-V screen, which looks like a folder, to open the MarineProtectedAreas scenario. Tell students to again record lobster biomass data, for the MarineProtectedAreas model-based scenario, for the years 1970 and 2002.
NOTE: Like the Baseline scenario used in Activity VI, the MarineProtectedAreas scenario data is based on a model. It is easier to compare this graph to the graph of observational data in the NEFSCsurveytrawlandMammalBird scenario, since the two datasets have similar time spans.
Data in the MarineProtectedAreas scenario runs from 1964 to 2014, a close match to the span from 1963 to 2015 covered by the NEFSCsurveytrawlandMammalBird data. The Baseline scenario data, also from a model, runs from 1964 all the way out to 2083, which makes it harder to visually compare to the observational data in the NEFSCsurveytrawlandMammalBird scenario.

Figure 11: Lobster Biomass Data for the MarineProtectedAreas Scenario
NOTE: Table 6 shows the values for lobster biomass students should have recorded on worksheet #5. Their values might be slightly different, especially for the observational dataset, because of challenges reading the graphs. The scales on the graphs and the labels for years are not ideal, and the observational data fluctuates from year to year.
Year |
Lobster Biomass (metric tons) |
|
|
MarineProtectedAreas |
NEFSCsurveytrawlandMammalBird |
|
|
1970 |
25,000 |
20,000 |
|
2002 |
50,000 |
60,000 |
Table 6: Lobster Biomass Data, Observations and Modeled, 1970 and 2002
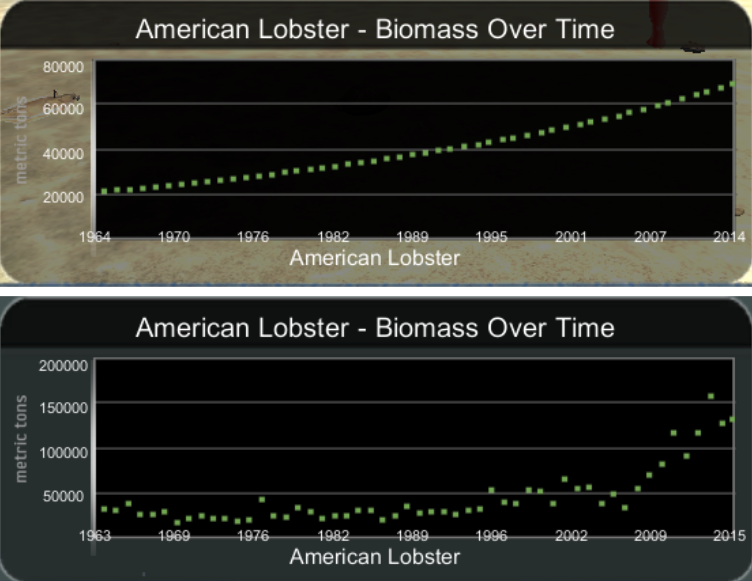
Discussion: Lobster model validation with your students. Ask your students about the general trend over time of lobster biomass in the observational data; did it increase, decrease, or stay about the same? They should notice that lobster biomass increased in the observational dataset over this roughly 30-year span.
Ask your students about the trend in the model-based dataset. They should notice that lobster biomass also increased in the model-based dataset over the same timespan.
Next, ask them about the scale of the increase in each case. Did lobster biomass double, increase by 10 times, increase by 100 times, or something else? Students should notice that lobster biomass tripled in the observational dataset. In the model-based scenario, lobster biomass doubled.
NOTE: Although the observations and model don’t match exactly, they aren’t dramatically different, either. If there was an increase in biomass in one dataset but a decrease in the other, our confidence in the validity of the model would be low. If biomass increased in both scenarios, but by a factor of 10 in one scenario but only doubling in the other, our confidence in the validity of the model would still not be very high. So, overall, this model compares pretty well with observational data. The model has pretty-good validity, and could be used to predict future lobster biomass with fair confidence.

Figure 12: Comparing Model-based (Top) and Observational Lobster Biomass Data