
Students will discover some of the challenges and explore some of the techniques used to collect observational data about living organisms. They will explore these ideas in two contexts: gathering berries in a garden and observing birds at a bird feeder.
Estimating the population size of a particular species of fish within a region of the ocean isn’t so straightforward. The number of fish may be very large, we cannot see all of them at once, and they move around - a lot. We cannot directly count all of the fish in the sea. To get a reasonable estimate of fish population sizes, scientists use techniques that count some of the fish in a limited area at a certain time, then estimate the size of the entire population based on that limited sample.
To understand observational data about fish populations in VES-V, students will first look at some techniques scientists use to estimate population sizes in other environments. They will learn how to estimate the number of berries in a garden without counting all of them, and consider what the birds observed at a bird feeder tell us about the overall population of birds in a region.
This activity will prepare them to explore the challenges of accurately observing populations in the wild and ultimately being that models are often used to make estimates about data besides weather or climate. Some ecological models provide estimates about the numbers and types of organisms in a habitat. Like weather and climate models, these ecological models are based on observations. The models are then used to estimate data values for times or places where direct observations were not made.
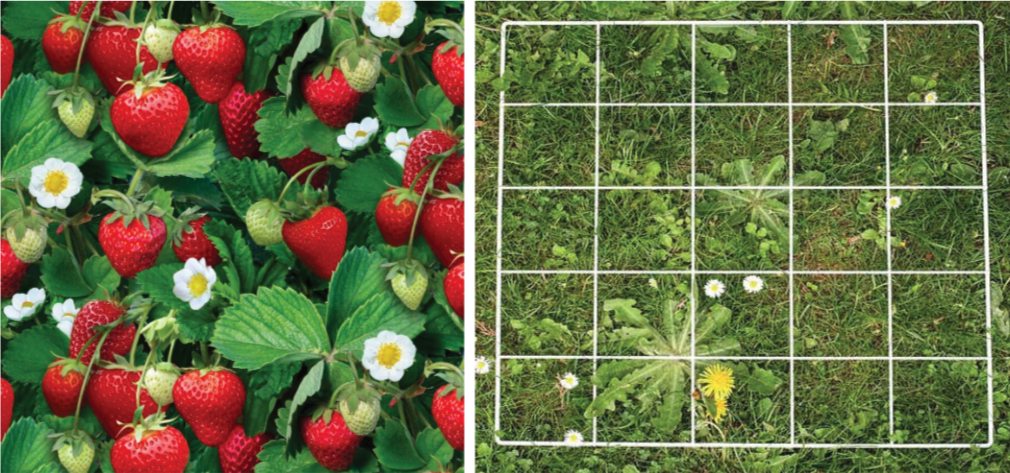
Ask your students to imagine they have a large garden with lots of strawberries, and they want to make some strawberry pies. The recipe says they will need about 500 strawberries for their pies. How can they determine whether there are enough strawberries in their garden for their pies, without having to tediously count 500 strawberries?

Figure 8: Strawberries and a Sampling Quadrat
NOTE: A technique ecologists use for this sort of problem involves sampling and extrapolation. They place a frame called a quadrat of a known size (usually 1 meter square) on the ground and count the number of each type of plant inside the frame. Then, they move the frame to a different place, and count the plants there. After doing that a few times, they calculate the average number of plants in a square meter. Next, the scientist measures the total area of the land they are studying, in square meters. Finally, they multiply the average number of plants per square meter by the number of square meters of land to estimate the total number of plants on the whole plot of land. Tell students that they will apply this approach to the strawberry pie problem.
Ask your students to imagine that they have counted the number of strawberries inside a 1 square meter quadrat at 3 places in their garden. (Table 5 shows how many strawberries they counted at each location.) Based on these data, ask your students to estimate the average number of strawberries per square meter in their garden. Have Tell students to record the results of their calculations onto “VES-V Observations & Model Data Lesson Worksheet #4: Strawberry Count Sampling”.
| Number of Strawberries | |
|---|---|
| Sample 1 | 15 |
| Sample 2 | 25 |
| Sample 3 | 20 |
Table 5: Number of Strawberries in Each of Three 1-meter Quadrats
NOTE: Since there are a total of 60 strawberries in the three 1-meter quadrats, the average number of strawberries per square meter in this sample is 20 (60 ÷ 3).
Next, inform the students that their strawberry patch is 5 meters wide and 10 meters long. Ask them to calculate the total area of the garden, and then to estimate the total number of strawberries based on the average number of strawberries per square meter in the three quadrats they sampled.
NOTE: The area of the garden is 50 square meters (5 meters x 10 meters). Multiplying the estimated number of strawberries per square meter by the total area of the garden yields an estimate of 1,000 strawberries in the whole garden (50 m2 x 20/m2). Since the strawberry pie recipe calls for 500 strawberries, the estimated 1,000 strawberries in the garden should be plenty for making two pies, even if the estimate is off by a bit.
Discussion: Ask your students how this technique might be used to estimate populations of marine organisms. Could it be used to determine the population of corals, oysters, or fish?
One could count the number of fish in an area of a known size, then repeat that count in a few different places of a similar known size to determine the average number of fish in an area of that size. Then, by multiplying the average number of fish by the total area that they live in, one could estimate the total number of fish in that area, just as they did with strawberries.
You could point out that as fish move around in three dimensions, a sampling technique for fish would need to use volumes instead of areas. One could count the fish in a cubic meter of water (approximately), then multiply that average by the total volume of the ocean area under consideration. The area technique could still be useful for bottom-dwelling fish or other creatures such as clams or coral, since they don’t move up or down in the water column.
These discussions will extend student thinking about the techniques used to sample and estimate strawberries to other populations of animals. Using the example of birds at a bird feeder, students will consider how well observations at the feeder represent the broader population of birds in the area near the feeder. Then they will discuss the challenges involved in using these sampling and estimation techniques for determining the populations of various marine organisms.
What other situations would be appropriate for using the strawberry counting method? For example, if a garden had snails, students could estimate the total number of snails in the garden the same way they did with strawberries. Since snails move slowly, they are almost as easy to count as non-moving plants. However, if there are many animals or if they move quickly, it is harder to apply this technique. It might still work well if the garden had a small number of slow-moving ladybugs. However, if there were many fast-moving ants in the garden plots, it might be very difficult to count them.

How might the strawberry quadrat technique be relevant to counting marine organisms, including fish? Immobile creatures like coral are easy to count, since, like strawberries, they don’t move around. Creatures like clams, scallops, and oysters are also pretty easy to count. They either don’t move or move slowly, like snails and ladybugs. Fast-moving fish are much harder to count. Small, fast-moving fish that come in large schools are really hard to count… probably even harder to count than ants in a garden.

How might the frequency of sampling impact the data collected? For example, what is the importance of taking enough samples in places that accurately represent the population you are studying. In the strawberry example, imagine that you can clearly see that one side of the garden is producing more strawberries than the other side. It would be wise to take a few samples from each side of the garden, to make sure the average of the counts in those quadrats is a reasonable representation of the whole garden. In the ocean, however, we cannot tell at a glance that there are lots of fish in one area and few in another. Scientists must be careful about their sampling process when trying to estimate population sizes of marine organisms. Also, the ocean is a three-dimensional environment. Some species live on or near the sea floor. Others stay very near the surface. Scientists must take that into account when sampling marine life. Encourage your students to note how some creatures are found at specific depths once they begin explorations in the simulated marine environments in VES-V.
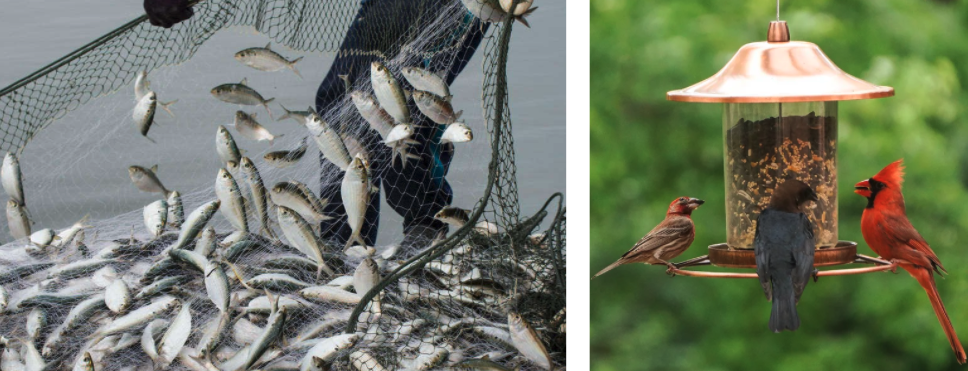
What are some of the practical realities to consider when sampling marine life? Explain to your students that sampling of marine life can be infrequent, or might rely on convenient existing samples. Months or longer might pass between surveys. Fish species that migrate, or are more frequent during specific seasons, might be underrepresented or overrepresented in a sample depending on timing. Some data about fish populations is derived from examining the catch of commercial fishing boats. Smaller species might slip through gaps in the fishnet, or the net might be set to catch fish at a certain depth, over-counting fish at that depth and under-counting other types of fish at other depths.

How might observing birds at a bird feeder or location where birds congregate potentially bias the data collected/observations made? Bird feeders provide another potentially familiar example that illustrates the challenges of sampling. Suppose you wanted to know what kinds of birds live in your neighborhood. You couldn’t really just count the ones that landed on a square meter of ground. You could, however, count the number and different kinds of birds at a bird feeder or at a specific location at a specific time. You could count the birds at a few different times of day. You would be taking samples at different times, just like you took samples at different places in your garden. You could team up with your neighbors, and have them count the types of birds at another feeder or a location near them. You could calculate the averages across the different times and different bird feeders to estimate the birds nearby.
What are some challenges that might arise when using this approach to estimate local bird populations? Challenges might include:
Some birds might not eat at feeders or congregate at certain locations at all.
Different feeders might have different kinds of seed, and different locations might attract different types of birds for many different reasons.
Some types of birds might feed or congregate only at certain times, so you might undercount or overcount them, depending on when you collected data.
Some birds, such as predators, don’t eat seeds or congregate with other birds, so they don’t visit feeders or go to areas where other birds are commonly seen.
How is sampling at a bird feeder is like estimating fish populations based on fish caught fishing nets? Some types of birds visit feeders a lot. That could make us think there are more of that type of bird around than is actually the case. Some fish are more likely to get caught in nets: if they are slow-moving, or swim in large schools, or tend to swim at the same depth as the net. That might make us assume there are more of those fish around than is actually true. Some birds, like predators, don’t visit feeders at all. Some types of fish might not show up, or might appear rarely, in nets. They might be fast enough to escape nets, or they might swim at a different depth than the net. Sampling that relies on counting these fish in nets might underestimate their population in the habitat.