
Students will conduct a “virtual dive” in VES-V to explore a habitat in the Atlantic Ocean off the northeast coast of the United States. They will use two different datasets to populate the organisms in the simulation. The first dataset has data generated by a model. The second dataset has data from observations. Students will try to distinguish between the two datasets, identifying which is model-based and which is based on observations.

Remind your students of the “Big Question”: “How do Individuals, communities or governments ensure that there is enough seafood for people to eat in the future? ” Ask them to consider how observations and models of fish populations might be used to determine future population levels for different species. Remind students that they should consider the ideas explored from considering models of temperature, counting strawberries in the garden, and birds at a feeder.
NOTE: The data used by VES-V might come from a model, or it might come from observations. VES-V is a tool that can be used to view data from different sources, both models and observations. Remind students of the global temperature graphs they looked at in Activity IV. Some of the temperature data displayed in those graphs came from models; some of it came from observations. Likewise, VES-V can use/present data from either observations or from a model to determine which, and how many, fish to display in a specific simulated environment. As your students look at the data in VES-V, they should try to decide whether it is based on observations or models.
Next, ask your students to conduct a “virtual dive” in VES-V. Direct them to the:
By default, VES-V will load data about fish populations from a model-based dataset. The dataset is called the Baseline scenario.
Ask students to explore the habitat. They should observe different species in different parts of the habitat, including bottom-dwellers, fish that stay near the surface, and others that swim at depths between the surface and the bottom. Encourage students to notice that some species move quickly and others move slowly or are immobile. It is also important for students to recognize that some species are predators (such as sharks) and others prey species. They should look at graphs of biomass for a few species, and use the time slider to see how populations change in the simulation over time.
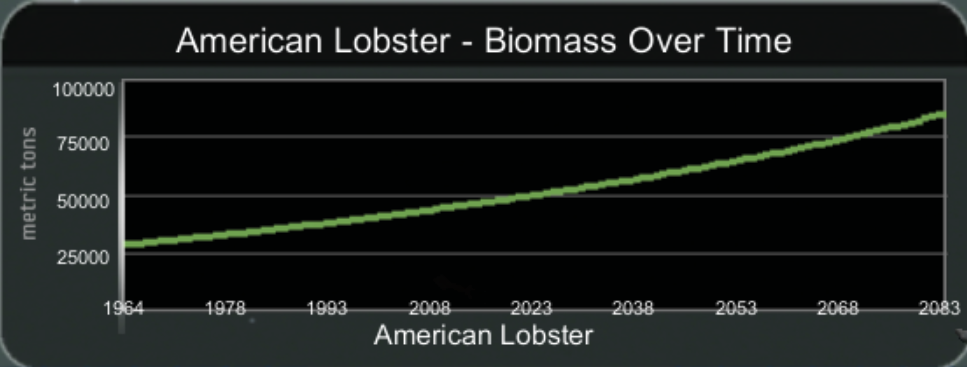
Ask your students whether this dataset is from observations or from a model. This dataset, called the Baseline scenario in VES-V, includes dates well into the future (to 2083), as can be seen in the biomass graphs. “Data about the future” is the key clue that this dataset must be from a model, not observations.

Figure 9: Lobster Biomass Data for the Baseline Scenario
Now students will look at an observation-based dataset. In the same habitat: Northeast, Gulf of Maine, sand flats, have your students switch datasets by clicking the green “SCN” (scenario) folder icon in the upper left. Have students switch to the NEFSCsurveytrawlandMammalBird scenario. They may need to use the arrow buttons to scroll down the list of scenarios to find it.
As with the previous dataset, students should observe several species of marine life and explore different regions in the water column. They should use the time slider to see how populations change over the years.

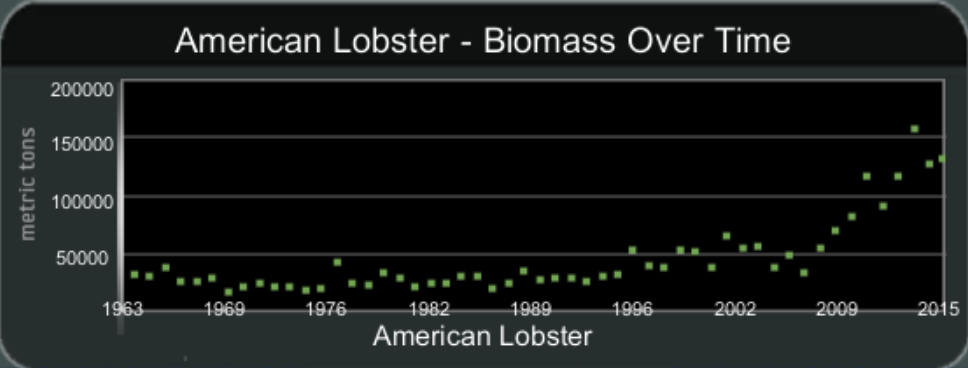
Figure 10: Lobster Biomass Data for the NEFSCsurveytrawlandMammalBird Scenario
Discussion: Ask your students whether this dataset was derived from observations or from a model. Since this new dataset only includes dates from the past, students should conclude that it could be observational data, though it could also be from a model.
After hearing your students’ views on whether this is observational or model-based data, and their reasoning for their conclusion, tell them that the NEFSCsurveytrawlandMammalBird scenario data is indeed derived from observations, not a model. However, there is no way to directly know that for certain just by looking at the data in VES-V.
Remind students of the global temperature graphs that they looked at in Activity IV. Note how, with those graphs, it was also impossible in some cases to know for certain whether the graph was based on observations or a model (or both!).