[ Modeling Marine Ecosystems with Virtual Reality: NOAA's National Ocean Service

U.S. flag An official website of the United States government.

dot gov icon Official websites use .gov

A .gov website belongs to an official government organization in the United States.

https icon Secure websites use HTTPS

A small lock or https:// means you’ve safely connected to a .gov website. Share sensitive information only on official, secure websites.

Predators and prey

Predators and Prey Module

Activity V: Model Validation with a Predator-Prey Historical Example

Activity Summary

Students will analyze population data from a “real world” predator-prey system. Students will compare data from this real world system with the simple predator-prey model they investigated in the previous activities. Students will observe similarities and differences between the model and the actual system.

NOTE: The Hudson Bay Company in Canada bought pelts from trappers during the 1800s and early 1900s. For 90 years, from 1845 to 1935, the Hudson Bay Company kept detailed records of the number of lynx and hare pelts they acquired from trappers each year. These counts of pelts provide an approximate measure of the lynx and hare population sizes during the 90-year period. The lynx and hare predator-prey relationship is a good real-world example of the simple predator-prey system modeled earlier in this lesson. Throughout much of their geographical range, the main food source for Canada lynx are snowshoe hares. Likewise, the main predators of snowshoe hares over most of their geographic range are Canada lynx. Although actual systems in the real world are never as neat, tidy, and well-defined as the simplified versions in models, the real-world relationship between lynx and hares is pretty similar to the idealized relationship in the model, with other predators or prey playing a very limited role in lynx and hare populations.

Procedure:

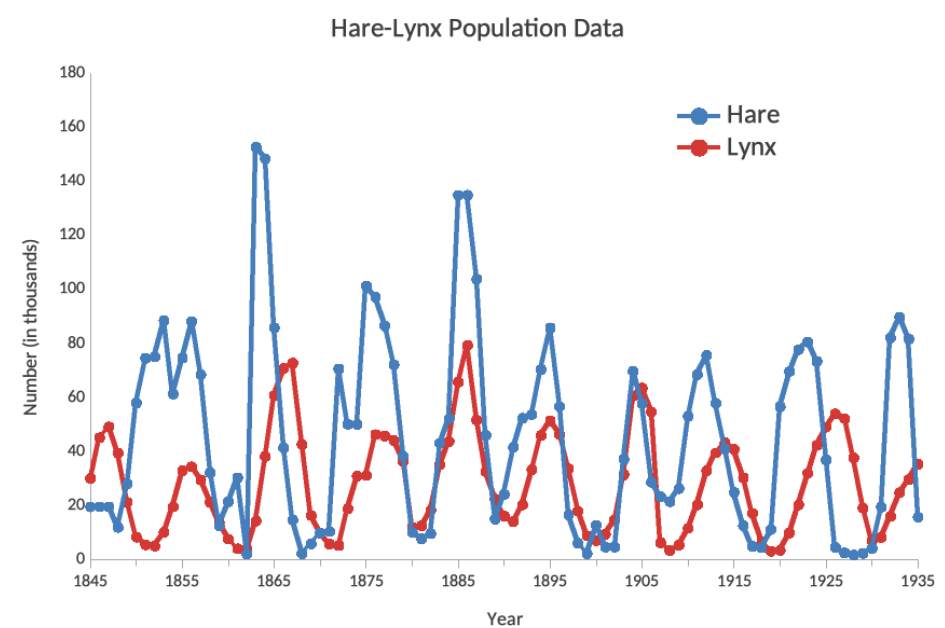
  1. Show Figure 7 to students and discuss its features with them. Figure 7 shows a graph of 90 years of data from the Hudson Bay Company. The graph shows the number (in thousands) of hare and lynx pelts acquired by the Hudson Bay Company. Discuss that the pelt count is not a direct record of the hare and lynx populations. However, it is reasonable to assume that the number of pelts collected is roughly proportional to the population of each species in Canada.

    Historical Hare and Lynx Population Data from Canada

    Figure 7: Historical Hare and Lynx Population Data from Canada

    NOTE: Students should notice that both the hare population and lynx population rise and fall in cycles, as was the case in the model. The graph of historical data isn’t as smooth as the graph of model data, which is generally the case. The peaks and valleys of population levels for both species vary substantially in shape and maximum values. In several cases (especially around 1865, 1915 and 1925) the lynx population clearly peaked slightly after the peak of the hare population. This matches the behaviors seen in the model, and fits well with the understanding that lynx have more offspring when food is plentiful.

  2. Discuss some of the limitations of this dataset with students. The data represents the number of pelts turned in to the Hudson Bay Company, not the actual population of that creature in the wild.

    NOTE: Other factors besides the actual population would have influenced the number of animals captured and pelts turned in i.e. the relative value of lynx versus hare pelts, the relative ease of capturing each creature, and so on. It seems likely that the population of hares in the wild must have been much greater than the number of pelts turned in. In general, there are significantly more individual prey organisms than individual predators in most ecosystems. In many cases, the ratio is around 10 prey for every 1 predator. That is clearly not the case in terms of the pelts in Figure 7. For example, around 1905 the number of lynx and hare pelts were nearly the same.

  3. Discuss with students whether and how models might be useful in making predictions about real-world systems. Help students notice that large fluctuations from cycle to cycle in the historical data were not present in the model. The strength of models is typically not in predicting an exact population value at a specific future time, however, the shape and pattern of the model-based graph was similar to the historical data. Models, therefore, can be helpful when making predictions about overall patterns or trends.