[ Modeling Marine Ecosystems with Virtual Reality: NOAA's National Ocean Service

U.S. flag An official website of the United States government.

dot gov icon Official websites use .gov

A .gov website belongs to an official government organization in the United States.

https icon Secure websites use HTTPS

A small lock or https:// means you’ve safely connected to a .gov website. Share sensitive information only on official, secure websites.

Predators and prey

Predators and Prey Module

Activity IV: Analyzing Results of a Predator-Prey Model

Activity Summary

Students will analyze graphs of hare and lynx populations produced by the predator-prey spreadsheet model. This analysis will provide students with the opportunity to observe the relationships between the two populations, and how each population changes in relation to the other. Ultimately, students will formulate and state a principle about how the two populations change in response to each other. Students will make connections between the graphs and mathematical model and the basic behaviors of lynx and hares that generate the patterns observed in the graphs.

Procedure:

  1. Ask students to look at some specific sections of the graph of hare and lynx populations (Figure 3 below).

    • Ask students to estimate the average hare population over the 600-month range of the graph. Students should readily observe that the average hare population is around 100 or slightly higher.

    • Ask students what they expect to happen to the lynx population when there are lots of hares. Students should surmise that when there are many hares, the lynx have plenty to eat and have more offspring, increasing the lynx population.

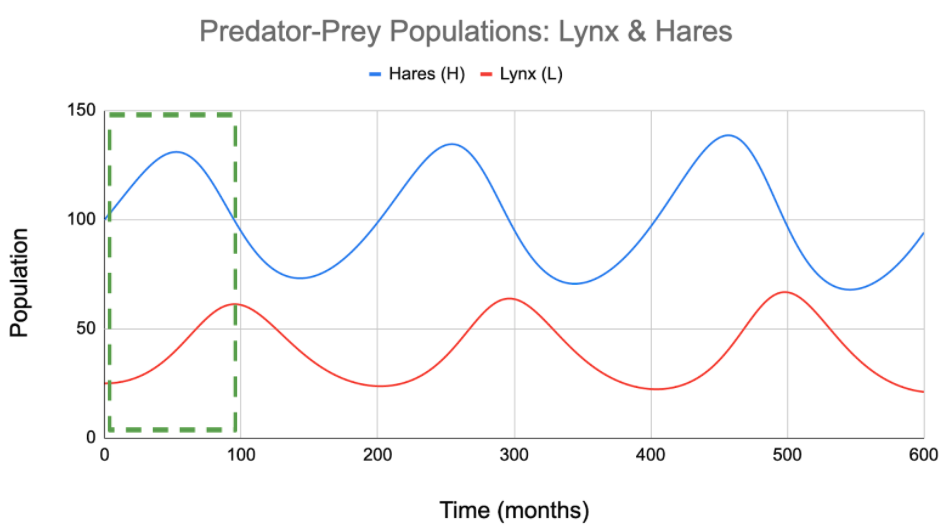
    • Draw students’ attention to the first section of the graph where the hare population is above average, from the start of the graph until just before 100 months. Ask students what is happening with the lynx population during those first 90 or 100 months. As shown in Figure 3, the lynx population is rising during that timespan, as was predicted would happen when food for lynx is plentiful.

      Lynx Population Increases when Hare Population is High

      Figure 3: Lynx Population Increases when Hare Population is High

  2. Ask students what they expect to happen to the lynx population when the hare population is low. Students should realize that lack of food should cause a decrease in the lynx birth rate, and thus also a decrease in the lynx population.

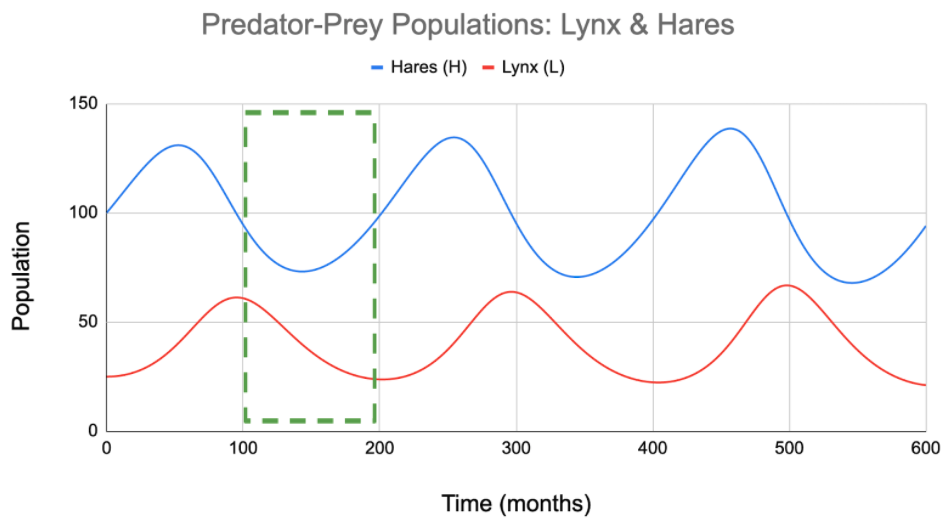
  3. Draw students’ attention to the segment of the graph between 100 and 200 months, when the hare population was below average. Students should observe that, as expected, the lynx population decreased when there were fewer hares to eat. Figure 4 highlights that portion of the graph.

    Lynx Population Decreases when Hare Population is Low

    Figure 4: Lynx Population Decreases when Hare Population is Low

  4. Ask students what they expect to happen to the lynx population when the hare population is low. Students should realize that lack of food should cause a decrease in the lynx birth rate, and thus also a decrease in the lynx population.

  5. Draw students’ attention to the segment of the graph between 100 and 200 months, when the hare population was below average. Students should observe that, as expected, the lynx population decreased when there were fewer hares to eat. Figure 4 highlights that portion of the graph.

  6. Ask students to estimate the average lynx population during the 600-month span of the graph. Students should see that the average number of lynx was around 40. Ask students to hypothesize the effect on the hare population when the number of lynx is high. Students should reason that more hares get eaten when there are more lynx around, and thus the hare population should decrease.

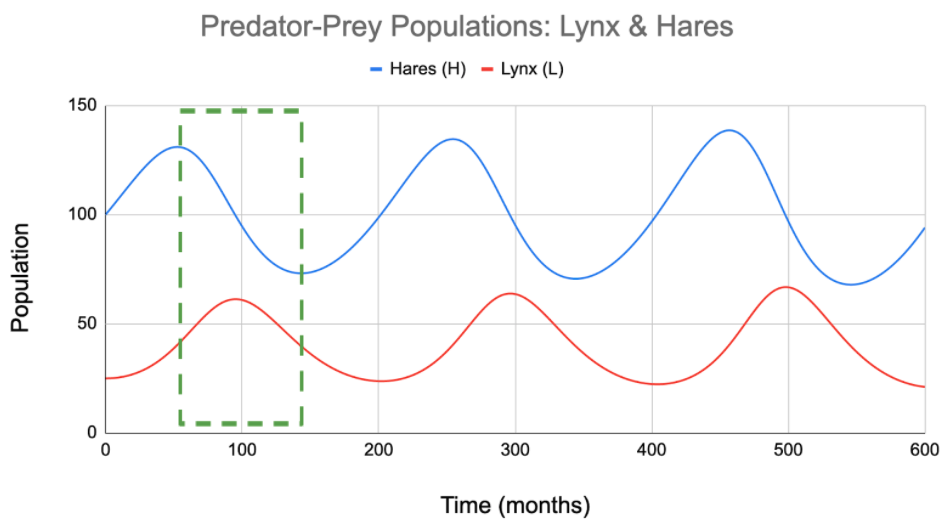
  7. Encourage students to look closely at the first section on the graph where the lynx population is high, between months 50 to 150. Ask students to observe the change in hare population during that timespan. As shown in Figure 5, students should realize that the hare population did indeed drop when there were plenty of lynx, as one would expect.

    Hare Population Decreases when Lynx Population is High

    Figure 5: Hare Population Decreases when Lynx Population is High

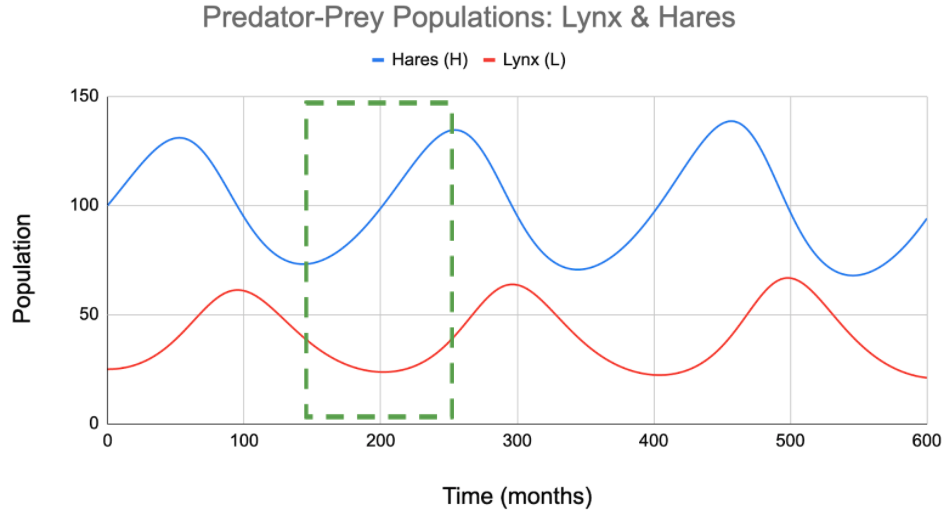
  8. Finally, ask students to predict the effect on the hare population when there are relatively few lynx. Students should realize that, with fewer predators eating them, the hares would increase in number. The first section of the graph which illustrates that situation runs from about 150 to 250 months, when the lynx population was below average. Figure 6 clearly shows that the hare population increased during that time.
    Hare Population Increases when Lynx Population is Low

    Figure 6: Hare Population Increases when Lynx Population is Low

  9. Have students record their observations about the relationships between lynx and hare populations in this model on “VES-V Predator-Prey Lesson Worksheet #1: Lynx and Hare Populations Vary Together”.