The Office of Coast Survey (OCS) provides navigation products and services that ensure safe and efficient maritime commerce on America’s ocean and coastal waters in the Great Lakes.
NOAA Partners with Universities on Hydrographic Training, Research, and Development
NOS Priorities: Accelerate Growth of the Ocean Enterprise and Blue Economy
NOAA and the University of New Hampshire (UNH) are expanding a 24-year surveying and mapping education partnership through the creation of a new Center of Excellence for Operational Ocean and Great Lakes Mapping. The Center of Excellence is funded through $10 million in NOAA’s FY 2023 budget, and will complement existing research, technical expertise and advanced educational programs at the NOAA-UNH Joint Hydrographic Center and UNH’s Center for Coastal and Ocean Mapping. The Center of Excellence will focus on delivering practical hydrographic training and fostering workforce development for ocean mapping operations and providing technical expertise and systems support for NOAA’s mapping operations on an increasingly diverse set of platforms, including for new ships and uncrewed survey vessels. It will also partner with academia and industry to transition ocean mapping research to operations.
NOAA and the University of South Florida’s Center for Ocean Mapping and Innovative Technologies reached students with various training activities in 2023. Eleven university students spent time aboard NOAA Ship Nancy Foster during the Blake Plateau expedition to gain hands-on experiential learning on seafloor mapping. NOAA also partnered with the Water Studies Institute at Northwestern Michigan College to develop a lakebed mapping capstone course for undergraduate students in marine technology. The college’s marine technology degree programs were launched in 2019 to address the demand for surveying skills and the shortage of survey technicians in the ocean-mapping industry. NOAA expects these opportunities to continue in the future to enhance public-private partnerships and to train a diverse workforce skilled in the sciences supporting ocean mapping to advance navigation safety and climate resilience.
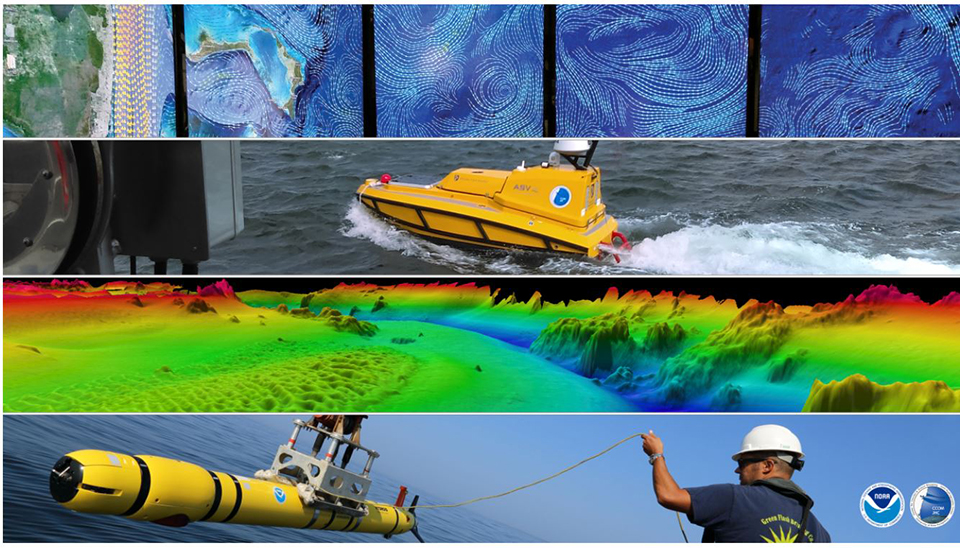
From top to bottom: The Visual Lab at University of New Hampshire/Joint Hydrographic Center; an uncrewed surface vessel during survey operations; a digital terrain map of the entrance to Portsmouth Harbor, New Hampshire; an autonomous underwater vehicle being deployed. (Credit: NOAA and University of New Hampshire/Joint Hydrographic Center)
NOAA Performs High Resolution Mapping to Improve Flood Forecasts
NOS Priorities: Accelerate Growth of the Ocean Enterprise and Blue Economy; Conserve, Restore, and Connect Healthy Coastal and Marine Ecosystems
NOAA received $28.8 million (FY 22 $16.8 million and FY 23 $12 million) to acquire and process bathymetric data on behalf of NOAA’s National Water Center under the Bipartisan Infrastructure Law. The priority areas for FY 22 and FY 23 were the mid-Atlantic and northwest Florida. Bathymetric models developed with the collected data will be used to help forecasters at NOAA’s National Water Center with hydrodynamic modeling to improve understanding of the timing and the impact of rapid river stage increases and decreases, the duration of high water, and flood inundation or drought. The surveys will be used to update NOAA’s nautical charts and products and to characterize seabed habitat to help manage a healthy and sustainable seafood industry. The surveys also will inform best preservation practices for operating and conserving maritime historic and cultural resources in the Mallows Bay-Potomac River National Marine Sanctuary.
With little modern bathymetry in the project areas, the surveys were conducted by NOAA’s navigation response teams (NRT), NOAA Ship Thomas Jefferson, and contractors. Both the St. Mary’s River and Elizabeth River were surveyed by NRT Bay Hydro II and accompanied by an uncrewed surface vehicle, the Echoboat 240. The response teams supported projects in the Elk River and St. Mary’s River/Potomac, Maryland; Elizabeth River, Virginia; and Mobile River, Alabama. NOAA Ship Thomas Jefferson surveyed the Chesapeake Bay at the Potomac River mouth and contractor survey support occurred in Albemarle Sound, North Carolina, in the approaches to Mobile Bay and Tensaw River, and in the Potomac, Rappahannock, James, and York rivers.
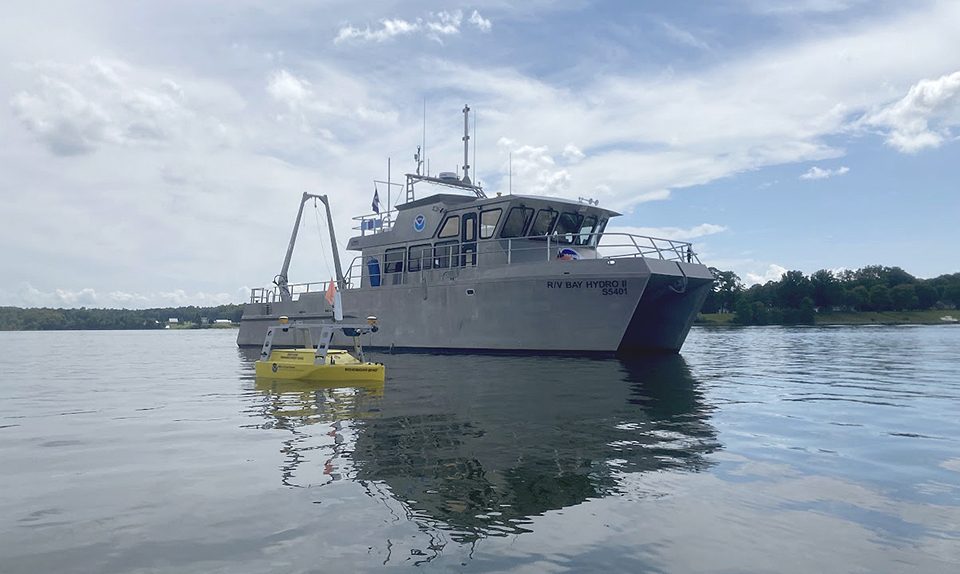
NOAA's Bay Hydro II on the water with the Echoboat 240, an uncrewed surface vehicle, in the foreground. (Credit: NOAA)
Progress to Survey and Map U.S. Waters Reaches Important Milestone
NOS Priorities: Accelerate Growth of the Ocean Enterprise and Blue Economy; Conserve, Restore, and Connect Healthy Coastal and Marine Ecosystems
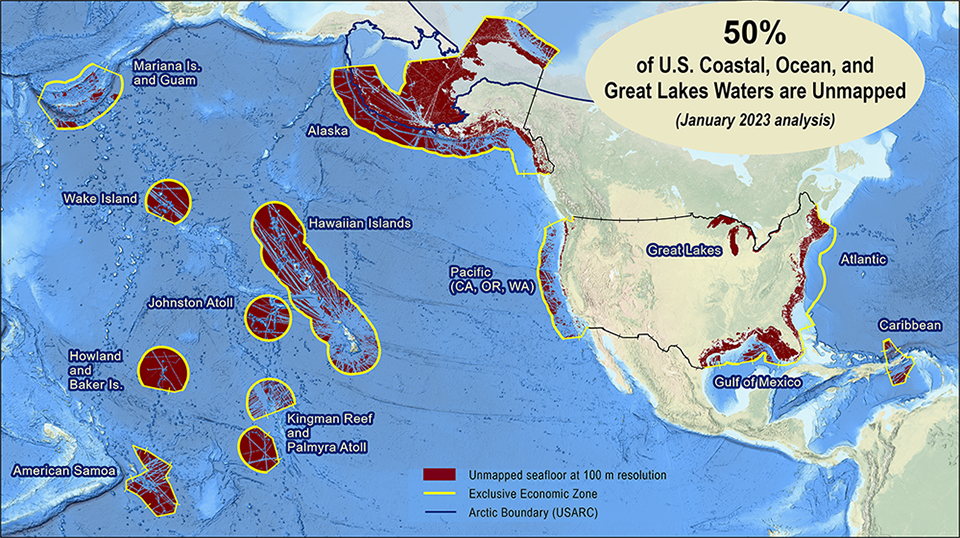
The fourth annual Progress Report on Unmapped U.S. Waters shows that 50 percent of U.S. waters remained unmapped as of January 2023, a decrease of 2 percent since January 2022. This progress report, compiled by NOAA and released by the Interagency Working Group on Ocean and Coastal Mapping, shows that roughly 67,700 square nautical miles of new bathymetric data have been published at NOAA archives since the last analysis. The 2020 National Strategy for Mapping, Exploring, and Characterizing the United States Exclusive Economic Zone and the global Seabed 2030 initiative makes comprehensive ocean mapping a priority for the coming decade. NOAA signed a memorandum of understanding with Seabed 2030 in 2022, formalizing U.S. participation in Seabed 2030 and supporting NOAA’s many mission areas reliant on bathymetry.
Much of the newly collected data comes from NOAA-led projects like the series of Seascape Alaska expeditions, held during summer 2023, on NOAA Ship Okeanos Explorer, and in collaboration with the U.S. Geological Survey (USGS) on NOAA Ship Fairweather. These expeditions focused on the Aleutian Islands, Gulf of Alaska, Aleutian Trench, and a large portion of the southern Alaskan continental margin, offshore of the Alaska/Kenai peninsulas. Project results improve USGS’s earthquake, tsunami, and landslide hazard assessments and forecasting, and NOAA Fisheries’ delineation of trawlable and untrawlable seabeds for sustainable management of Gulf of Alaska fish stocks.
Percentage of coastal, ocean, and Great Lakes waters of the United States that were unmapped as of January 2023. (Credit: NOAA)
NOAA’s 2023 Survey Season Was Successful
NOS Priorities: Accelerate Growth of the Ocean Enterprise and Blue Economy; Conserve, Restore, and Connect Healthy Coastal and Marine Ecosystems
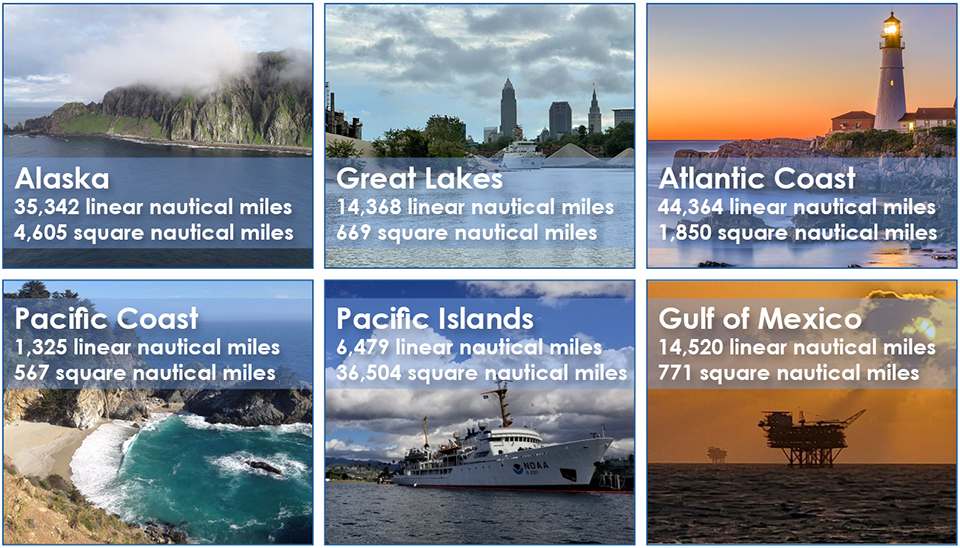
NOAA hydrographic survey ships, navigation response teams, and contractors began their survey season in March 2023. The ships and survey vessels collected bathymetric data for mapping the seafloor to support nautical charting, modeling, and research. They also collected other environmental data to support a variety of ecosystem sciences. NOAA considers hydrographic survey requests from stakeholders such as marine pilots, local port authorities, the U.S. Coast Guard, and the boating community, and it also considers other hydrographic and NOAA science priorities when determining where to survey and when. Visit the “living” ArcGIS StoryMap to find out more about NOAA’s mapping projects.
These regional images represent areas where hydrographic data was collected. The numbers for linear nautical miles and square nautical miles are current as of September 2023. (Credit: NOAA)
New Version of NOAA Custom Chart Released to the Public
NOS Priorities: Accelerate Growth of the Ocean Enterprise and Blue Economy
NOAA Custom Chart, a web-based application used to generate a customized paper nautical chart product, released version 2.0 in February 2023. These custom charts are created directly from the latest official data available within NOAA’s electronic navigational charts (NOAA ENC®). The application outputs a geospatially referenced PDF file, which can then be printed and used to augment navigation using official NOAA ENCs. Updates from this version include the addition of the Personal Chart Catalog; a streamlined user interface that describes each setting; further improvement of chart symbols; additional page size options; and the addition of more chart notes, particularly for areas where traditional paper charts have been canceled. In September 2023, NOAA released several updates for the application. These changes are reflected in the Nautical Chart Display Service and are summarized in this technical announcement.
NOAA looks forward to future enhancements, which include improved compass rose placement, enhanced text labels, and options for use of additional types of chart symbols. Traditional paper and raster charts are still updated on a weekly basis with critical navigation changes that are released in the U.S. Coast Guard Local Notice to Mariners. However, other changes, such as data from new shoreline and bathymetric surveys, and other noncritical changes that are routinely applied to the ENC are no longer compiled onto traditional paper and raster charts. Although NOAA will end production of its traditional paper nautical charts by January 2025, it will continue to provide users access to paper charts created directly from ENC data via the NOAA Custom Chart application.
A graphic of the NOAA Custom Chart application banner. (Credit: NOAA)
NOAA Implements New Version of nowCOAST™
NOS Priorities: Accelerate Growth of the Ocean Enterprise and Blue Economy; Increase U.S. Coastal Resilience
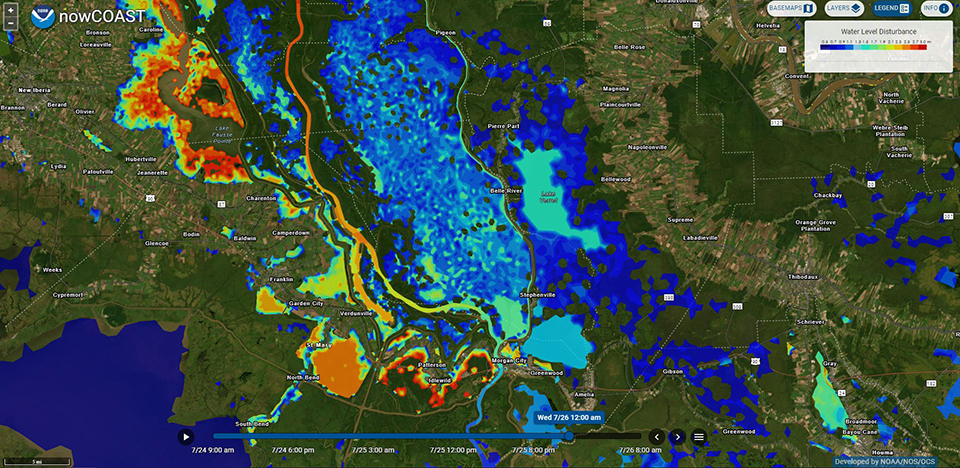
NOAA’s nowCOAST™ is a GIS-based web map service that provides frequently updated weather and ocean observations along with coastal and marine weather forecasts 24 hours a day. The service provides present and predicted oceanographic, meteorological, and hydrologic information along with bathymetric data for U.S. coastal areas in support of precision marine navigation and coastal climate and hazard resilience. NOAA’s nowCOAST™ integrates observations, imagery, and information from across NOAA and other federal agencies via web mapping services and an interactive map viewer. In April 2023, NOAA implemented a new open-source, cloud-based version of the service. With the service running in the cloud, it will be able to automatically scale to maintain steady map response times for users during significant weather events or environmental coastal disasters, such as hurricanes making landfall. The service also features a new mobile-friendly map viewer that allows users to display datasets as well as visualize and overlay datasets available from National Weather Service (NWS) map services on desktops, laptops, and mobile devices. These datasets include forecast guidance from NOS Coastal and Great Lakes Operational Forecast Systems; NOS Surge and Tide Operational Forecast System; NOS BlueTopo™ bathymetry; NWS watches, warnings, and advisories; NWS tropical cyclone track and intensity forecasts; NWS Potential Storm Surge Flooding Map; National Environmental Satellite, Data and Information Service satellite imagery; and the National Aeronautical and Space Administration sea-surface temperature analysis.
NOAA’s nowCoast™ visualization of the three-dimensional coastal storm surge includes inland hydrology extremes (STOFS-3D-Atlantic) — Lower Mississippi region. (Credit: NOAA)
 An official website of the United States government.
Social