Hurricane Florence, the first major hurricane of the 2018 Atlantic hurricane season, made landfall as a Category 1 storm near Wrightsville Beach, North Carolina, on September 15, 2018. The historic legacy of Hurricane Florence will be record-breaking storm surge of nine to 13 feet and devastating rainfall of 20 to 30 inches, which produced catastrophic and life-threatening flooding. In Fiscal Year 2018, staff from across the National Ocean Service supported the impacted communities by delivering coastal science, management, and operational expertise. Following is a summary of some of those activities.
Before/after Hurricane Florence imagery of North Topsail Beach, North Carolina, taken by NOS's National Geodetic Survey.
The Center for Operational Oceanographic Products and Services (CO-OPS) issued 24 Storm QuickLook postings every six hours throughout Hurricane Florence. Storm QuickLooks provide a synopsis of near real-time oceanographic and meteorological observations at locations affected by a storm. For the first time, CO-OPS communicated real-time water level information via NOS social media during the storm. CO-OPS also provided tidal information to the Office of Coast Survey to support its post-storm emergency hydrographic surveys. During the storm, several stations in North Carolina broke records for the highest recorded water levels. CO-OPS products detected record-breaking flooding during Hurricane Florence throughout North Carolina. In Wrightsville, North Carolina, the water was 4.11 feet above Mean Higher High Water (MHHW), eclipsing the previous measured record of 2.97 feet caused by Hurricane Joaquin in 2015. Water in Wilmington, North Carolina, was 3.6 feet above MHHW, exceeding the previous record of 3.48 feet set during Hurricane Matthew in 2016. The water levels at the Beaufort, Duke Marine Lab in North Carolina was 3.75 feet above MHHW, exceeding the previous record of 3.39 feet set during Hurricanes Hazel and Ione in 1954 and 1955, respectively. CO-OPS also provided emergency tide support to the Office of Coast Survey for seven bathymetric surveys associated with Hurricane Florence.
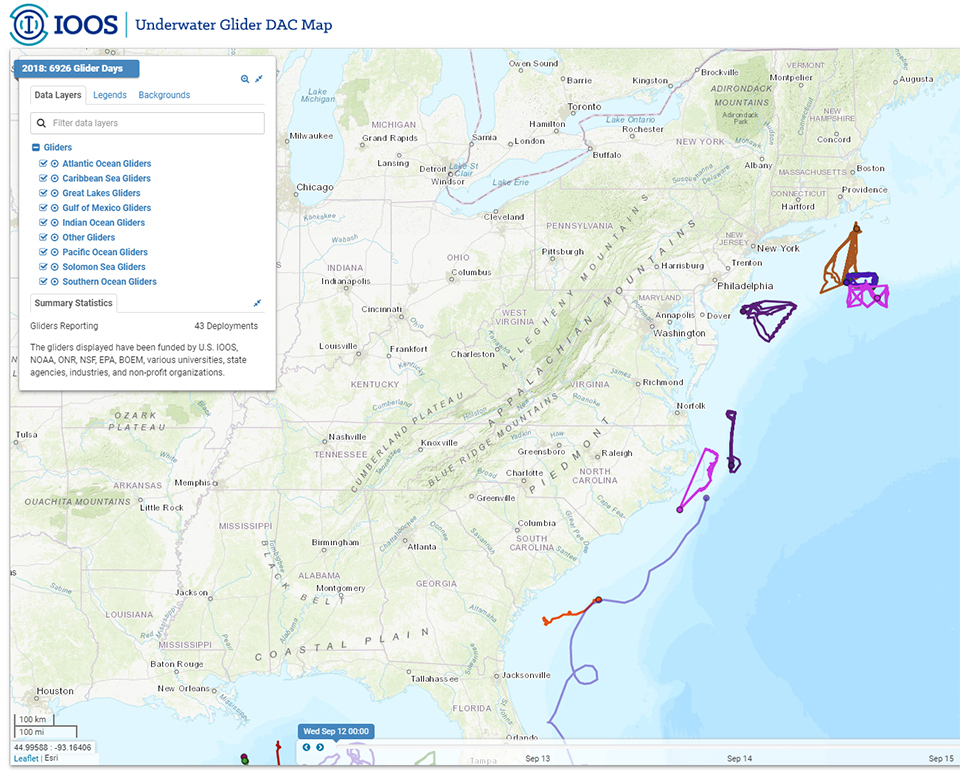
The U.S. Integrated Ocean Observing System (IOOS®) worked closely with its Southeast Coastal Ocean Observing Regional Association (SECOORA) to monitor Hurricane Florence aftermath and assist with emergency response. SECOORA deployed two gliders off the North Carolina and Georgia coasts to gather sea surface temperature and salinity data before and during the storm. Gliders transmitted data to the IOOS Glider DAC continuously throughout the storm. Data from Florence can be found on SECOORA's Florence Dashboard, and general hurricane resources are on the IOOS Hurricane Resources page.
This image, from the U.S. IOOS Glider Data Assembly Center shows tracks from gliders Pelagia (SECOORA), Ramses (NSF PEACH), NOAA Spray, RU33 (Rutgers/MARACOOS), BLUE (UMass), and unnamed (NSF OOI). Gliders from a range of federal and non-federal sources share their data with the U.S. IOOS Glider DAC, a central location that makes it possible to visualize, analyze, and distribute a wide array of glider data via existing web services and the Global Telecommunications System (GTS), and are archived at the National Centers for Environmental Information (NCEI).
The National Geodetic Survey (NGS) collected damage-assessment imagery of areas identified by NOAA in coordination with the Federal Emergency Management Agency as well as other state and federal interests. A team of NOAA aviators and sensor operators captured the images via specialized remote-sensing cameras aboard NOAA's King Air aircraft flying at altitudes ranging from 500–3,500 feet. Imagery was processed and posted online within 12 hours, including flight and processing time, and was available online via the NGS aerial imagery viewer. NOAA's aerial imagery captures storm damage to coastal areas and aids safe navigation. It is a cost-effective tool for determining the extent of flood damages and assessing damage to major ports and waterways, coastlines, infrastructure, and coastal communities.
The Office for Coastal Management (OCM) coordinated with North Carolina and South Carolina estuarine research reserves and Coastal Zone Management (CZM) programs to identify needs and increase awareness of, and access to, relevant NOAA resources in response to Hurricane Florence. CZM emergency permitting programs were put in place to hasten community recovery efforts. Through the online Digital Coast platform and other means, OCM staff provided resources to aid in recovery efforts, including LIDAR, elevation, and land cover data; risk and vulnerability assessment methods; and coastal flood inundation and impacts maps. OCM also provided space in Charleston, North Carolina, for NOAA’s National Geodetic Survey to upload flight data, and gave on-site technical assistance to the Charleston National Weather Service and the National Hurricane Center in Miami, Florida, with surge modeling and mapping.
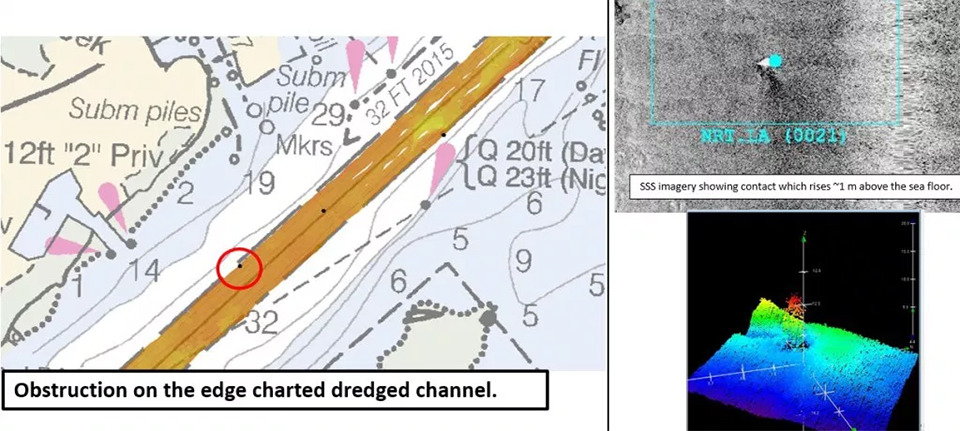
The Office of Coast Survey’s (OCS)National Response Teams (NRTs) stationed in Fernandina Beach, Florida, traveled to Wilmington, North Carolina, and coordinated with the U.S. Army Corps of Engineers (USACE) to survey the Cape Fear River post-Hurricane Florence. The team collected side scan sonar and multibeam echo sounder data in junction with NOAA Ship Ferdinand R. Hassler's survey data of the Cape Fear River. The team worked around the clock to provide the U.S. Coast Guard (USCG) with condition surveys of the storm’s approach, channel, and critical terminals. Local USACE personnel affected by the hurricane relied heavily on OCS field units and their surveys to assist in the decision to reopen the ports of Wilmington and Morehead City, North Carolina. In addition, while conducting hydrographic surveys at the request of the USCG following Hurricane Florence, NOAA’s NRTs identified hazardous obstructions in the Cape Fear River channel. Since these dangers to navigation remained in place while the port reopened, NOAA updated its charts with the new hazards and distributed them to the port, USCG, and key stakeholders. The time from the survey to the publication of the chart was less than 24 hours, an unprecedented accomplishment for OCS.
One of the four objects detected in the Cape Fear River by a NOAA Navigation Response Team and reported to the U.S. Coast Guard on September 17, 2018. (Note: chartlet not for navigation.)
In advance of Hurricane Florence, the Office of Response and Restoration (OR&R) facilitated daily coordination calls with several other NOAA entities along the coast to prepare for potential impacts to NOAA staff, assets, and facilities. OR&R deployed scientific support coordinators and spatial data experts to the scene, as well as staff to support the North Carolina Joint Information Center. Other OR&R team members coordinated with various state, federal, and nongovernmental agencies to develop best management practices to minimize any collateral impacts from the displaced vessels and address Threatened and Endangered Species Act and Historic Preservation Act concerns. OR&R’s spatial data experts used the Environmental Response Management Application (ERMA) as a common operating picture to analyze aerial imagery from the National Geodetic Survey to locate displaced vessels and potential hazardous substance releases. Identification of these targets allowed the U.S. Coast Guard to move forward with tagging vessels for removal in addition to other activities. Much of the success in responding to Florence can be attributed to the prolonged response during the 2017 hurricane season and the lessons learned that stemmed from several months of response activities in the U.S. Virgin Islands, Puerto Rico, and other impacted areas.
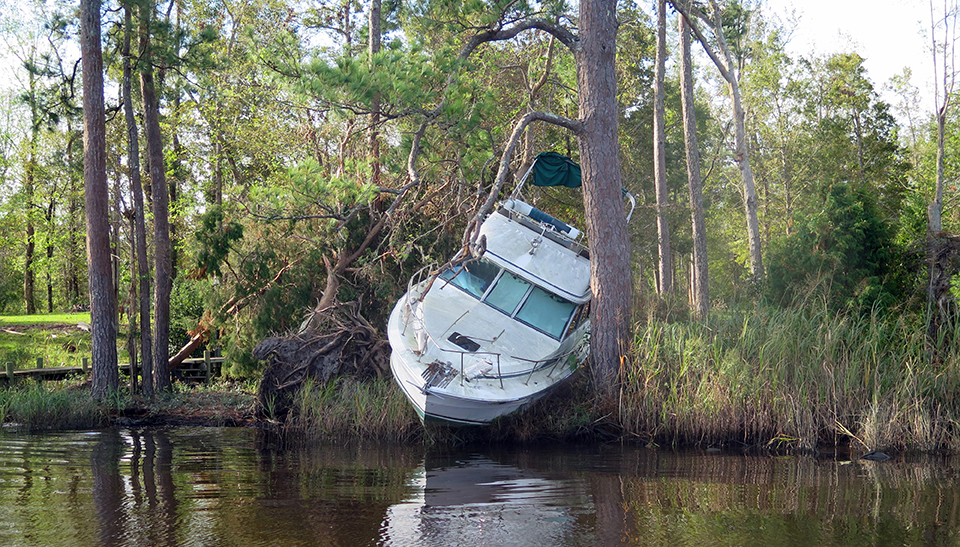
Boat stranded on land following Hurricane Florence.
 An official website of the United States government.

Social