Center for Operational Oceanographic Products and Services
NOS Fiscal Year 2018 Year in Review
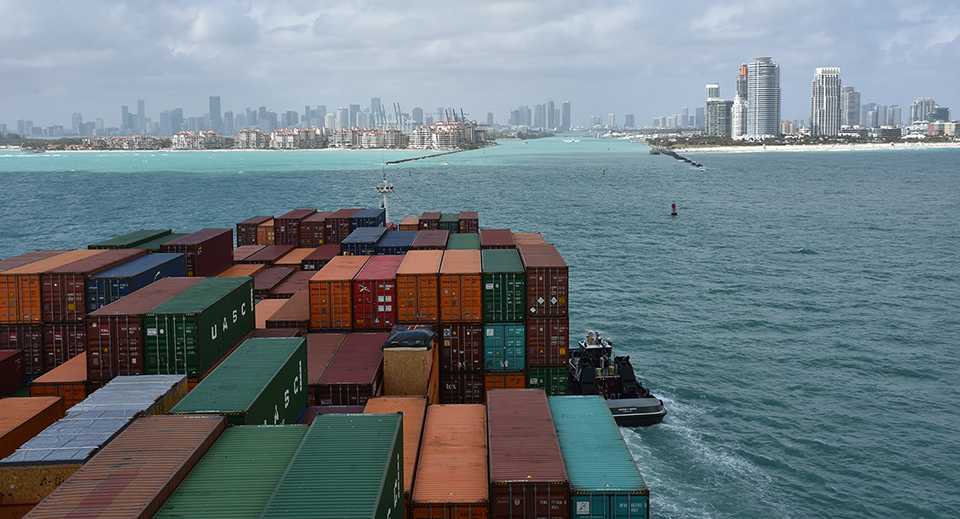
A container ship enters the shipping channel at PortMiami, where vessel pilots now have access to real-time current information to help guide them safely into port. The system that allows them to do this — Physical Oceanographic Real-Time System (PORTS®) — is deployed in many busy waterways throughout the U.S. to provide key environmental parameters, including water levels, currents, waves, salinity, bridge clearance (air gap), winds, air and water temperature, and visibility. Sensors are tailored to meet specific needs at each seaport.
PORTS® Program Brings Safer Marine Navigation to More U.S. Seaports
SUPPORTS NOS PRIORITY: SAFE AND EFFICIENT TRANSPORTATION AND COMMERCE
The Center for Operational Oceanographic Products and Services (CO-OPS) has expanded the Physical Oceanographic Real-Time System (PORTS®) to four additional U.S. seaports. Port Miami and Port Everglades in Florida, Port of Toledo in Ohio, and the Port of Corpus Christi in Texas have all partnered with CO-OPS to add real-time sensors to their seaports to improve safe navigation. Using PORTS, partners can reduce ship accidents by more than 50 percent, increase the amount of cargo that ships can carry, reduce transit delays for commercial traffic, enhance recreational activities, and improve hazardous spill response. PORTS is a successful public-private partnership program between NOAA and local partners and is currently in 33 locations nationwide. Partners ensure that the program is tailored to their local needs by identifying which sensors will help them make the best decisions for safety of life and property at their unique location.
CO-OPS Releases 2018 High Tide Flooding Annual Outlook
SUPPORTS NOS PRIORITY: PREPAREDNESS AND RISK REDUCTION
The Center for Operational Oceanographic Products and Services (CO-OPS) released the 2017 State of U.S. High Tide Flooding with a 2018 Outlook as part of the National Centers for Environmental Information’s State of the Climate Report. During 2017, the U.S. average frequency for high tide flooding was the highest ever measured by 98 of NOAA’s tide gauges. More than one fourth of coastal locations outside of Alaska tied or broke their individual records for high tide flood frequencies. The 2018 high tide flooding outlook predicted that high tide flooding would be 60 percent higher across U.S. coastlines when compared to two decades ago. This predicted change was due primarily to local sea level rise and predicted El Niño conditions. In this year’s report, the authors assessed coastal high tide flooding based on new, national flooding thresholds that focus on more impactful, deeper floods at some locations and expanded the outlook to 98 coastal locations. Using this new method helps establish a national coastal flooding vulnerability assessment that can help identify flooding that would typically impact infrastructure throughout a region, rather than at a single location. As they examine their risk, communities can use this information to help better mitigate and prepare for high tide flooding from long-term sea level rise.
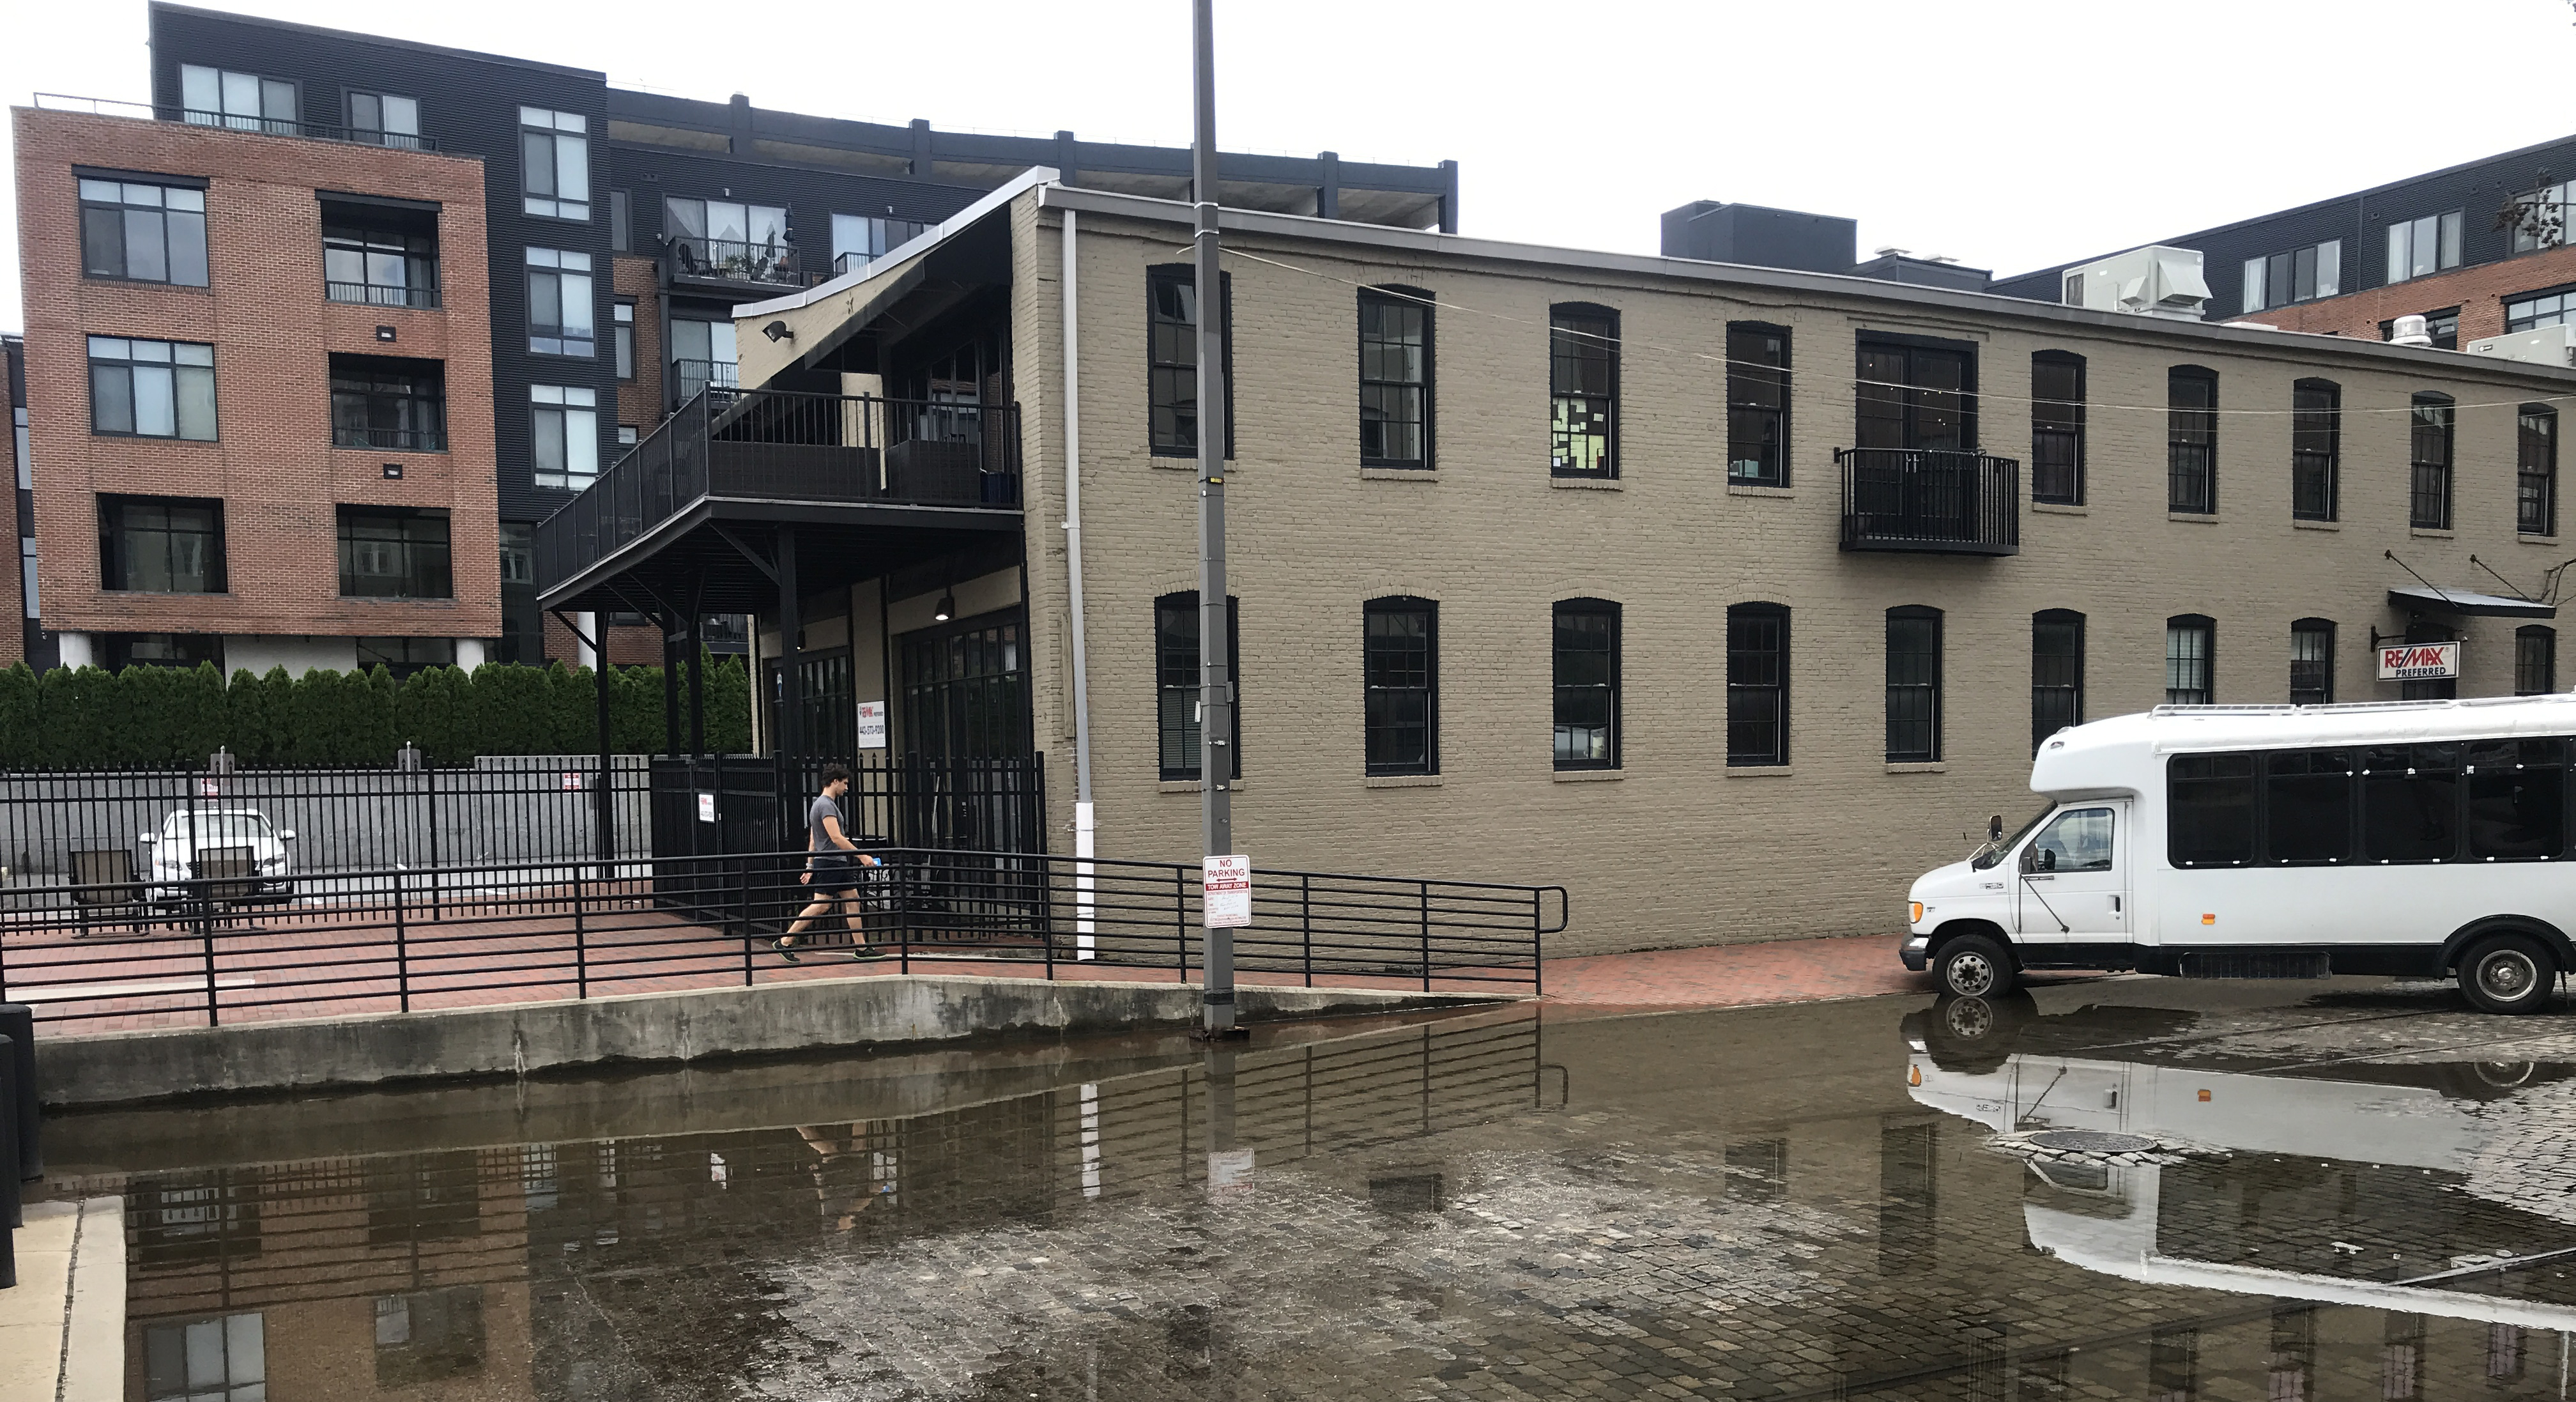
Water in the streets during a high tide event on a storm-free day in Baltimore, Maryland.
CO-OPS HAB Forecast Delivers Critical Information During Worst HAB Events in Years
SUPPORTS NOS PRIORITY: PREPAREDNESS AND RISK REDUCTION
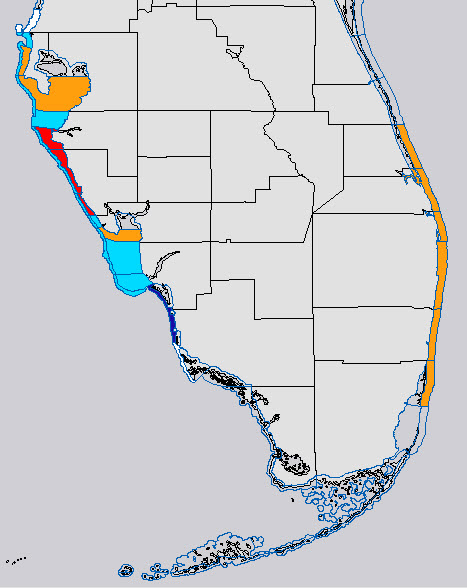
Screenshot of a CO-OPS HAB forecast. Forecasts help people make decisions about where and when to visit areas that may be temporarily affected by a bloom.
The Center for Operational Oceanographic Products and Services (CO-OPS) monitored daily conditions and issued twice-weekly forecasts for the red tide bloom in the eastern Gulf of Mexico. The 2018 bloom spanned a large part of the west coast of Florida, causing significant respiratory impacts to humans and killing fish, sea turtles, manatees, and dolphins. The National Weather Service used CO-OPS’ forecasts to release a Beach Hazard Statement to the public when the respiratory impacts reached a high threshold. Information on where the bloom was located and a 3-4 day forecast for potential respiratory irritation was also available online to the public. Hundreds of state and local coastal resource managers, public health officials, and research scientists received a forecast bulletin providing additional information on the size and trajectory of the bloom, allowing managers to take appropriate actions and focus sampling efforts.
CO-OPS Implements New Forecast System in the Gulf of Maine
SUPPORTS NOS PRIORITY: SAFE AND EFFICIENT TRANSPORTATION AND COMMERCE
The Center for Operational Oceanographic Products and Services (CO-OPS) unveiled a new Operational Forecast System (OFS) for the Gulf of Maine region, providing users with forecast guidance on water levels, currents, water temperature, and salinity. The model, which forecasts conditions out to 72 hours, promotes safe navigation by helping mariners better plan their transit and prevent accidents. The information can also be used in other applications for coastal management, ecosystem restoration and protection, harmful algal bloom forecasting, and emergency response. The new OFS is based on Rutgers University’s Regional Ocean Modeling System and runs on NOAA’s high performance computers in a new Coastal Ocean Modeling Framework. As a result, the model has direct access to National Weather Service operational meteorological products, which it needs to run reliably.
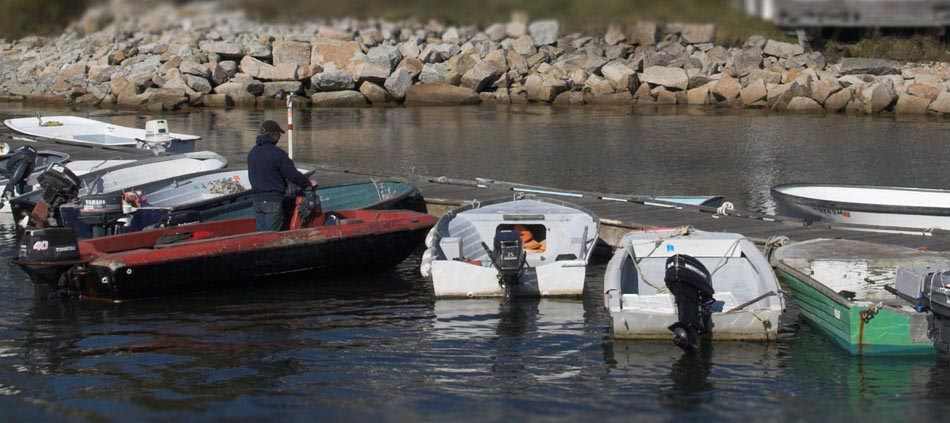
Mariners, like the one pictured here, can use the forecast system to help them safely navigate the Gulf of Maine.
 An official website of the United States government.
Social