Maritime Commerce in a Changing Climate
How NOS supports a resilient coastal economy today — and into the future.
 An official website of the United States government.
Here's how you know we're official.
A .gov website belongs to an official government organization in the United States.
A small lock or https:// means you’ve safely connected to a .gov website. Share sensitive information only on official, secure websites.
The National Ocean Service provides wide-ranging support — from overhauling marine navigation data, to providing 24/7 high tide flooding outlooks, to upgrading the availability of real-time water and weather data in our nation's busiest ports. Our infrastructure and technological investments strengthen the resilience of our coastal economy in the face of sea level rise and other impacts of a changing climate.
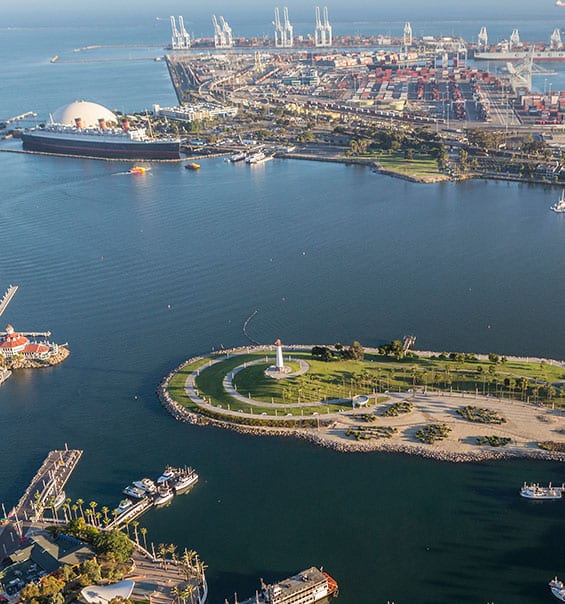
Aerial view of Long Beach, California. Credit: iStock
Precision marine navigation is the ability of a vessel to safely and efficiently navigate within U.S. waters, operating in close proximity to the seafloor, narrow channels, or other hazards. NOAA’s Precision Marine Navigation Program envisions a one-stop-shop for marine navigation data, integrating forecasts, real-time observations, warnings and advisories, and high-resolution bathymetry. This program, once fully operational, will seamlessly integrate high-resolution bathymetry, high-accuracy positioning, and shoreline data with forecast data of water levels, currents, waves, and weather information. All of this data will be integrated into maritime electronic charting systems and other decision support tools so it is easy to access. As a result, mariners will be better equipped to make critical navigation decisions because the collective value of these datasets is even more powerful when they are integrated. Mariners operating in both U.S. coastal waters and the Great Lakes will use this additional foundational data and real-time observations to optimize their routes and safely maneuver their approach to and within congested ports and harbor areas. For example, by taking advantage of a strong current, a ship can operate well below its maximum speed while traveling just as efficiently. It has been shown that a speed reduction of just 10% may result in a 19% reduction in total average emissions. Accurate water level forecasts and updated high-resolution bathymetry can also reduce the need for lightering and the environmental risk associated with the transfer of toxic materials, decrease the time a vessel is docked, and cut down on port congestion. Real-time observations can help to ensure that a ship avoids a grounding, an accident, or serious weather hazards while in transit.
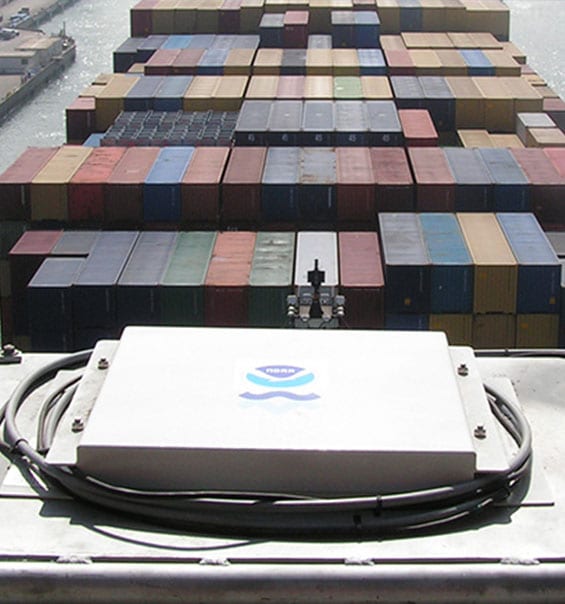
A NOAA air gap sensor installed on a bridge. Credit: NOAA
NOAA's Physical Oceanographic Real Time System, or PORTS®, is a valuable decision support tool from the Center for Operational Oceanographic Products and Services (CO-OPS). PORTS improves the safety and efficiency of maritime commerce and coastal resource management, providing mariners with a concentration of real-time oceanographic and meteorological observations in and around busy seaports. This data is critical for decision-making while transiting to and from terminal/pier destinations. PORTS covers seaports with 89% of tonnage (import/exports) and 91% of value of ship-borne international trade. Exponential program growth is driven by ever larger vessels, the oil and gas industry, and national security interests. A concentration of real-time observations from PORTS allows for additional real-time data for mariners, port authorities, and terminal operators operating in a given area. The reliability of PORTS data makes possible improved safety decisions, maritime commerce efficiency, environmental protection/planning assistance, and coastal forecasts — all vital in keeping maritime commerce flowing as seamlessly as possible in and out of seaports in any types of conditions. Most NOAA PORTS provide data for multiple seaport complexes within the same system (for example, multiple seaports benefit from NOAA’s San Francisco Bay PORTS). As new PORTS come online and existing PORTS are improved, NOAA experts are planning and accounting for impacts from sea level rise and increased storm activity. PORTS real-time observations will be a key component of NOAA Precision Marine Navigation service delivery.
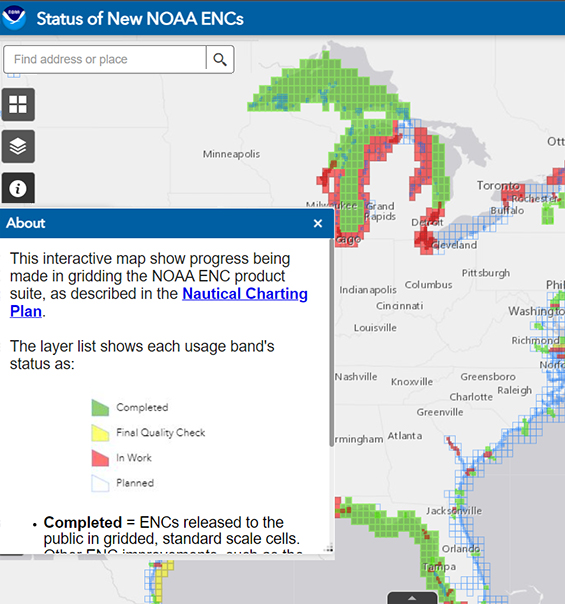
A map showing the progress of gridding the NOAA ENC product suite. Credit: NOAA
The Office of Coast Survey is undergoing a multi-year effort to improve its Electronic Navigational Chart suite for the maritime community. Overall, this effort will enhance navigation data available to mariners and improve chart coverage for smaller coastal communities and large ports. It also sets the stage for the transition of ENC data to a revised international specification that is due to be operational by 2026. This modernization process will allow for shorter turnaround times in updating ENCs as new bathymetry, shoreline, and other information becomes available — increasingly essential as climate and extreme weather events alter shorelines and bathymetry. By creating new larger-scale and smaller-footprint products, Coast Survey aims to streamline the application of updates, providing information faster to the maritime community. Smaller footprints for ENCs are also able to better display restricted areas, dangers to navigation, and offshore wind lease areas in much greater detail, which will enhance the safe operation of vessels.
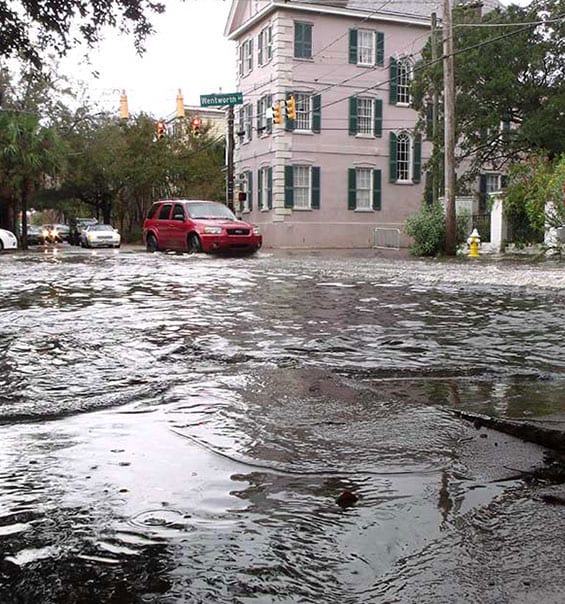
High tide flooding affecting traffic in Charleston, South Carolina. Credit: NOAA
In 2023, CO-OPS launched new and improved high tide flooding outlooks. These outlooks provide coastal communities and seaports around the nation with the information they need to prepare over the short- and long-term for potential flooding and impacts to their infrastructure. As relative sea levels rise, high tide flooding is occurring more frequently — even on sunny days. High tide flooding creates short-term impacts like road and business closures, as well as overflowing storm drains. Over the long term, recurrent high tide flooding causes more severe impacts, like damage to below-ground infrastructure and degraded wetlands. For our nation's maritime industries and communities, high tide flooding can inundate seaports and recurrent flooding events could compromise the longevity of port infrastructure. CO-OPS is now working to get the word out to key stakeholders who may not be aware of NOAA's new monthly and annual reports. A key area of outreach is to seaports — ideally ones with NOAA PORTS or in locations experiencing or predicted to experience frequent coastal flooding. For these places, CO-OPS experts are targetting communications to share how these ports can use this information for both short- and long-term coastal inundation planning. Additionally, CO-OPS is expanding efforts to communicate climate impacts to seaports and maritime communities through existing and planned high tide flooding communications messaging and products. Ports also rely on other transportation networks (roads and rail) to transport cargo that are similarly vulnerable to high tide flooding impacts. Understanding the risks to these other transportation networks is an important part of ensuring a port’s resilience.
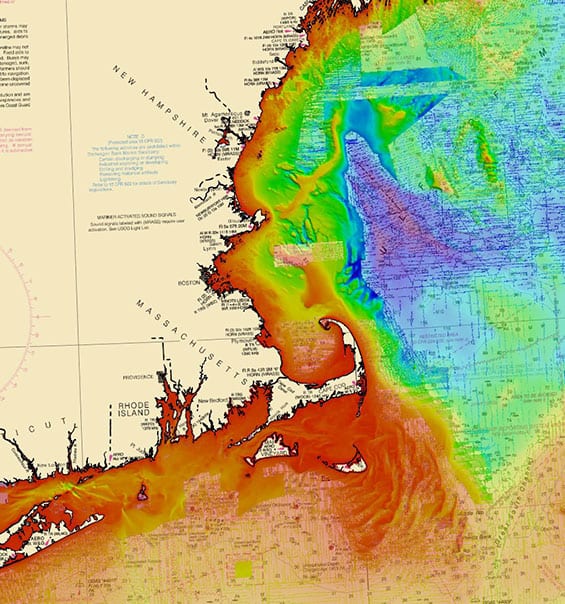
This chart shows bathymetry of the ocean bottom along the coast of New England. Credit: NOAA
The Office of Coast Survey acquires and processes the nation's bathymetry and is the authoritative source for all offshore depth data within the 3.6 million square nautical mile area extending from the coastline out to the limits of the United States' Exclusive Economic Zone. Hydrographic survey projects are planned and executed each survey season within Coast Survey for NOAA ships, hydrographic survey contractors, and Coast Survey's own navigation response teams. These surveys provide high-quality bathymetric data that serves many uses beyond nautical charting. The areas planned for each survey are carefully selected based on analytical tools and feedback from local maritime communities and serve to increase safety and efficiency in U.S. waters. Additionally, the National Bathymetric Source (NBS) program provides critical bathymetric data for new NOS operational numerical oceanographic forecast modeling systems. These real-time modeling systems provide short-term forecast guidance of water levels, currents, water temperature, and salinity to mariners. Within Coast Survey, NBS modeling products are used in operational storm surge and tide forecast modeling systems, such as the Global Surge and Tide Operational Forecast System 2-D and Three-Dimensional Component for the Atlantic Basin for the U.S. East Coast, Gulf of Mexico, and Puerto Rico. These forecast systems are used by local port operators to adjust port operations as necessary during major water events and plan for long-term adjustments for sustainable port operations.
NOS is a trusted and authoritative source of a diverse suite of products and programs that bolster, protect, and restore our natural resources and economy. To provide foundational support for our nation's resilience in the face of these challenges, NOS is stepping into a larger role relative to filling our nation's needs for data, products, and services that protect our ecosystems and enhance climate and economic resilience. Explore our 2024-2028 strategic plan to learn more.