Preparedness
Disaster Preparedness
The Disaster Preparedness Program (DPP), initiated in 2018 by the Office of Response and Restoration, expands on the activities of NOAA's Disaster Response Center in Mobile, Alabama. The program streamlines existing operational capabilities and knowledge to ensure that commerce, communities, and natural resources can recover as quickly as possible. The DPP also focuses on providing disaster response and recovery training, exercises, lessons learned, and resources within NOAA and to our emergency response partners across the nation to ensure that we are in the best possible position to respond to coastal threats quickly, safely, and effectively.
Water-level Monitoring
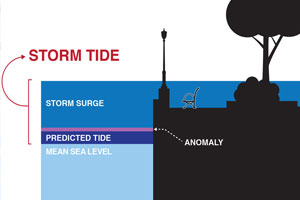
The Center for Operational Oceanographic Products and Services (CO-OPS) monitors and disseminates observations of water levels, currents, and weather information in real time via the National Water Level Observation Network and the Physical Oceanographic Real-Time System. Collected real-time environmental information helps coastal authorities prepare for, mitigate, and respond to storm tides and coastal flooding. NOS also regularly updates Storm QuickLook, an online compilation of ocean and weather observations within a coastal area.
Water-level Monitoring Tools:
- Inundation Dashboard
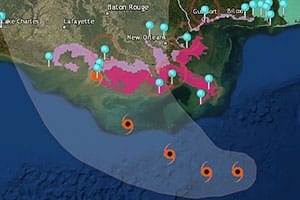
The Inundation Dashboard, an online map-based tool developed by CO-OPS, displays real-time and historic inundation information for over 150 NOS water level stations. Real-time alerts highlight stations that exceed or are forecast to exceed National Weather Service (NWS) flood impact thresholds. Historical data including annual flood days and top-ten water levels provide past inundation information at most locations. NWS tropical cyclone forecast information is integrated into the product, allowing users to easily see which stations are being impacted by storm surge to supplement NOAA's
Storm QuickLook product.
- Storm QuickLook
This website provides a synopsis of near real-time ocean and weather observations at specific water-level gauge locations affected by a tropical storm.
- National Water Level Observation Network Real-time Data
Tide and weather observations are available in real-time at the more than 200 National Water Level Observation Network observation platforms located throughout the U.S., Pacific Islands, and Caribbean.
- Sea Levels Trends
This website provides trends for sea level rise, calculated using data collected at National Water Level Observation Network tide stations for more than 150 years.
- Tidal Datums
This website provides tidal datums, which are standard elevations defined by a certain phase of the tide, for stations around the United States.
- NOAA Tide Predictions
The NOAA Tide Predictions application provides astronomical tide prediction tables for the calendar year at water-level stations around the U.S., searchable by name, station ID, or latitude/longitude.
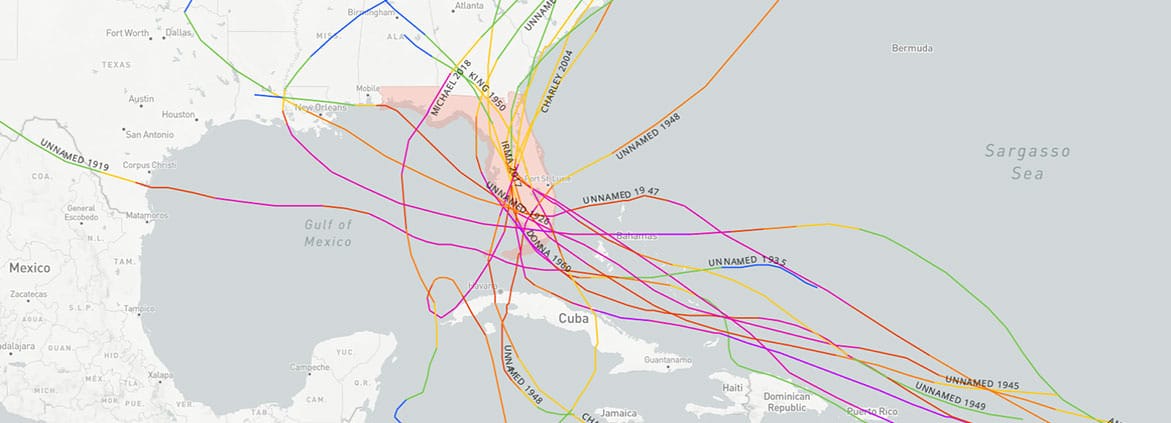
- Historical Hurricane Tracks
The Historical Hurricane Tracks tool allows users to track local historical storm activity, review specific storm tracks, and obtain information about a particular storm's landfall.
Ocean and Coastal Observations Data
NOAA coordinates the U.S. Integrated Ocean Observing System (IOOS®). This public/private partnership provides ocean and coastal data and information from multiple sources to support preparation and response efforts and to inform forecasts and predictions ahead of hurricanes. For example, the IOOS regions collect data inside the hurricane with unmanned, underwater robotic vehicles to increase understanding of hurricane intensity, and that information is made available through national and regional data portals and integrated into partner systems such as PORTS®. In addition, radar systems measure surface current speed and direction as hurricanes pass through, to aid models and forecasts. IOOS also partners with National Weather Service (NWS) to make High Frequency radar data accessible through the NWS Advanced Weather Interactive Processing System and National Centers for Environmental Prediction data tanks. IOOS data helps decision makers protect our safety, economy, and environment.
Observations Data Tools:
- Physical Oceanographic Real-Time System (PORTS®)
Located in 18 ports around the U.S., this system measures and disseminates real-time observations and predictions of water levels, currents, salinity, and meteorological parameters (e.g., winds, atmospheric pressure, and air and water temperatures) needed for safe navigation.
- Operational Forecast Systems
NOS operates hydrodynamic coastal oceanographic models that provide near-term forecasts of water levels, currents, salinity, and water temperature for a limited number of ports and estuaries in the United States.
- U.S. Integrated Ocean Observing System
The U.S. Integrated Ocean Observing System (IOOS®) website provides links to regional IOOS websites where users can access ocean and coastal data and information before, during, and after hurricanes and other disasters.
Response
Navigation Surveys
Immediately following a hurricane, the Office of Coast Survey provides emergency hydrographic services for affected port areas. These services are performed by Navigation Response Teams. These mobile emergency response units use echo sounders to check for submerged obstructions that pose hazards to vessels, collect data to update nautical charts, and provide mapping support. The work of these teams is essential to speeding the re-opening of ports and waterways. As of 2018, inventory of Coast Survey's Navigation Response branch also now includes portable Autonomous Surface Vessel (ASV) equipment capable of conducting singlebeam/sidescan sonar and multibeam surveys. Navigation Response Teams are working to integrate this mobile, unmanned equipment into operations in support of their standard survey operations and emergency response operations.
Emergency Response Imagery
As soon as weather permits following major natural disasters, the National Geodetic Survey begins aerial survey missions to assess damages to affected areas. Typical weather-related events include hurricanes, tornadoes, and floods. NGS responds to other events, such as oil spills, as well. Directly georeferenced-imagery data are collected, rapidly processed, and made available via open-source Geographic Information Systems (GIS). These data and images provide emergency and coastal managers with information needed to develop recovery strategies, facilitate search and rescue efforts, identify hazards to navigation and HAZMAT spills, locate errant vessels, and provide documentation necessary for damage assessment through the comparison of before-and-after imagery. Images are also available to view and download by the general public as a tool to assess impacts to their homes and community.
Emergency Response Imagery Tools:
- Emergency Response Imagery
The Emergency Response Imagery website access to aerial imagery such as photographs collected by NOAA aircraft following natural or human-made disasters.
- Emergency Response Imagery Mobile Web App
This web application allows emergency responders and the public to quickly access images of disaster-impacted areas collected by NOAA aircraft using standard web browsers, iOS, or Android mobile devices.
Pollution Response
After a hurricane, the Office of Response and Restoration (OR&R) provides scientific support to hazardous materials response efforts in coastal areas. The office surveys vessels or containers that may be leaking fuel, oil, or other hazardous materials; flies missions to identify and document spill sources; and uses computer models to predict spill movement and determine pollution threats. OR&R also provides guidance on marine debris and vessel salvage, conducts shoreline cleanup assessments, collects information to understand natural resource impacts from spills in affected areas, and works to assess and restore resources injured by spills.
Pollution Response Tools:
- ERMA
The Environmental Response Management Application (ERMA®) is an online mapping tool that integrates both static and real-time data, such as Environmental Sensitivity Index (ESI) maps, ship locations, weather, and ocean currents, in a centralized, easy-to-use format for environmental responders and decision makers.
Contaminant Assessments
NOAA’s National Status and Trends (NS&T) Program, part of the National Centers for Coastal Ocean Science, coordinates with multiple partners to develop strategies to assess the environmental impacts of contaminants in coastal and estuarine waters in the aftermath of hurricanes. Of special concern is assessing the risk to human health of eating fish and shellfish and ensuring seafood safety.
Maps and Data Analysis
The Office of Response and Restoration's Environmental Response Management Application (ERMA®) integrates static and real-time data for science based decisions in one common operational picture for emergency response. Following a hurricane, the Office for Coastal Management provides access to the aerial images collected by the National Geodetic Survey needed to generate maps that help officials understand the long-term effects of the hurricane.
Maps and Data Analysis Tools:
- Digital Coast
NOAA's Digital Coastal is an online access point for much of NOAA's data and tools that aid in hurricane recovery such as LIDAR data, coastal socio-economic and land use change data, Sea Level Rise Viewer, and Environmental Sensitivity Index (ESI) maps.
Event Response
The Effects of Sea Level Rise Event Response (ESLR ER) Program, part of the National Centers for Coastal Ocean Science, provides immediate assistance to individuals to gather data prior, during, and/or immediately after hurricanes and other events that are difficult to plan as part of a scientific study. The program expects these findings will help federal, state, and local officials manage events and make sound decisions leading to safer coastal communities and healthier coastal environments.
 An official website of the United States government.

Social