U.S. flag An official website of the United States government.

dot gov icon Official websites use .gov

A .gov website belongs to an official government organization in the United States.

https icon Secure websites use HTTPS

A small lock or https:// means you’ve safely connected to a .gov website. Share sensitive information only on official, secure websites.

What is a NOAA tide table?

NOAA Tide Tables provide daily high and low tide predictions for locations along the U.S. coastline.

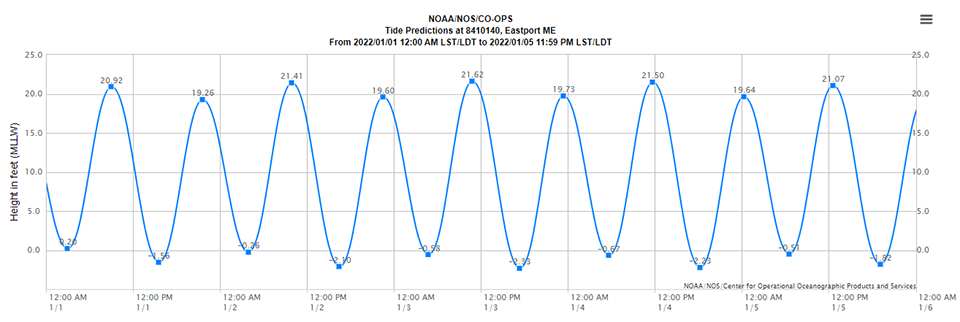
daily tide predictions for Eastport, Maine, for January 1-6, 2022

This image shows the daily tide predictions for Eastport, Maine, for January 1-6, 2022 generated through the modern electronic tide predictions service.

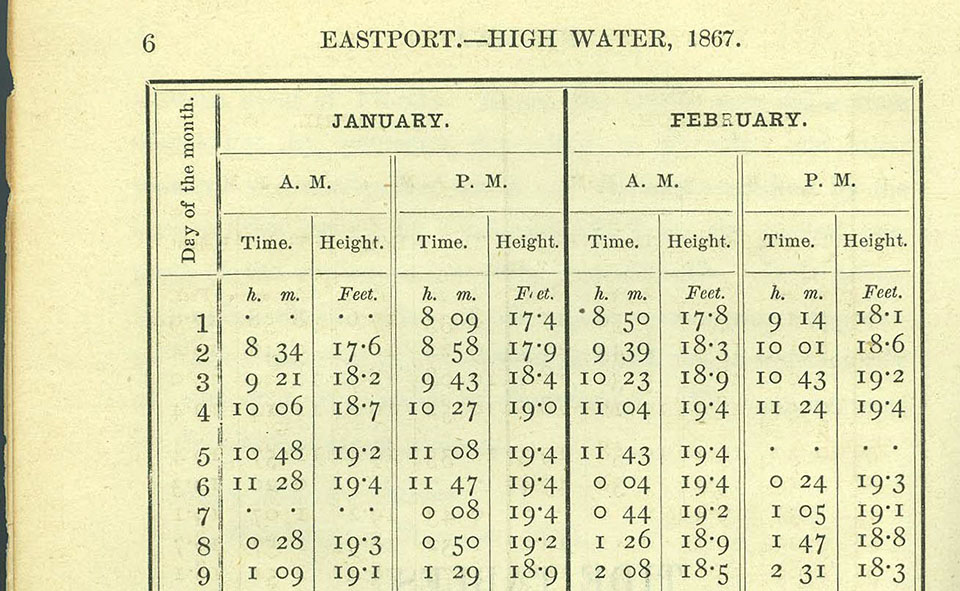
screenshot from first NOAA tide table publication

This image shows daily tide predictions for Eastport, Maine, for January-February 1867. This page is from the first edition of a national annual tide table publication created in 1866 by the U.S. Coast Survey, a predecessor of NOAA.

Tide tables provide the times and heights of high tide and low tide at more than 3000 locations along the U.S. coastline. NOAA’s Center for Operational Oceanographic Products and Services and predecessor agencies have produced annual tide tables for more than 150 years. These annual publications were produced in print form from 1865 to 2020 and were superseded by electronic predictions beginning in 2021. NOAA tide tables offer predictions on a daily, monthly, or annual basis.

Tide tables are different from tide charts. A tide chart is a printed map showing water levels on an hourly basis throughout a bay or an estuary at a particular point in time. Such charts were only available for only a few locations around the nation. However, these printed tide charts have been superseded by modern, digital hourly forecast models and graphical products.

To obtain tide predictions, tidal current predictions, or forecast model data, visit NOAA's Tides and Currents website: