NOAA formally joins international effort to map the gaps in our ocean knowledge
29 June, 2022
We know less about the ocean floor than we do about the surface of the moon and Mars. But by the end of the decade we may know the general outline of our undersea contours and crevasses, thanks to an international project called Seabed 2030. The mapping initiative — formally known as The Nippon Foundation-General Bathymetric Chart of the Oceans Seabed 2030 Project — launched in 2017 to “produce the definitive map of the world ocean floor by 2030.”
In June 2022, NOAA Administrator Rick Spinrad signed a memorandum of understanding in conjunction with the United Nations Ocean Conference that formalizes U.S. participation in Seabed 2030. The memorandum also describes best practices and protocols for this type of data collection, which will help build positive collaboration between all involved countries and partners.
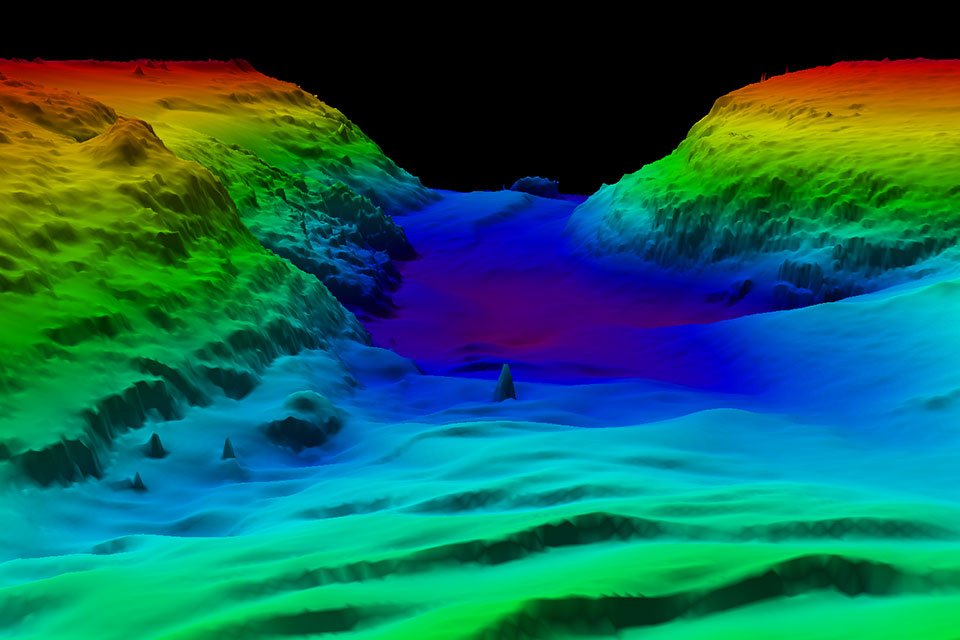
High-resolution bathymetry mapping data collected by multibeam sonar reveals complex topographic features of the seafloor in San Francisco Bay, California. In the same way that topographic maps represent the three-dimensional features (or relief) of overland terrain, bathymetric maps illustrate the land that lies underwater. Variations in sea-floor relief may be depicted by color and contour lines called depth contours or isobaths.
Seabed data is foundational for determining how the ocean works. Beyond navigation, the shape of the ocean floor plays a big role in the movement of ocean debris and pollution on its surfaces and currents. Knowledge about the depths can provide insights into sustainable fisheries management. Ocean acidification is also directly linked to depth; some areas may experience more chemical change and be less able to sustain healthy ecosystems than others.
Climate change impacts can also vary widely depending on depth since deeper areas may experience different temperature fluctuations than shallow areas. Identifying and monitoring underwater volcanoes also helps scientists predict tsunamis more effectively, potentially helping to save lives across huge swaths of coastline around the world.
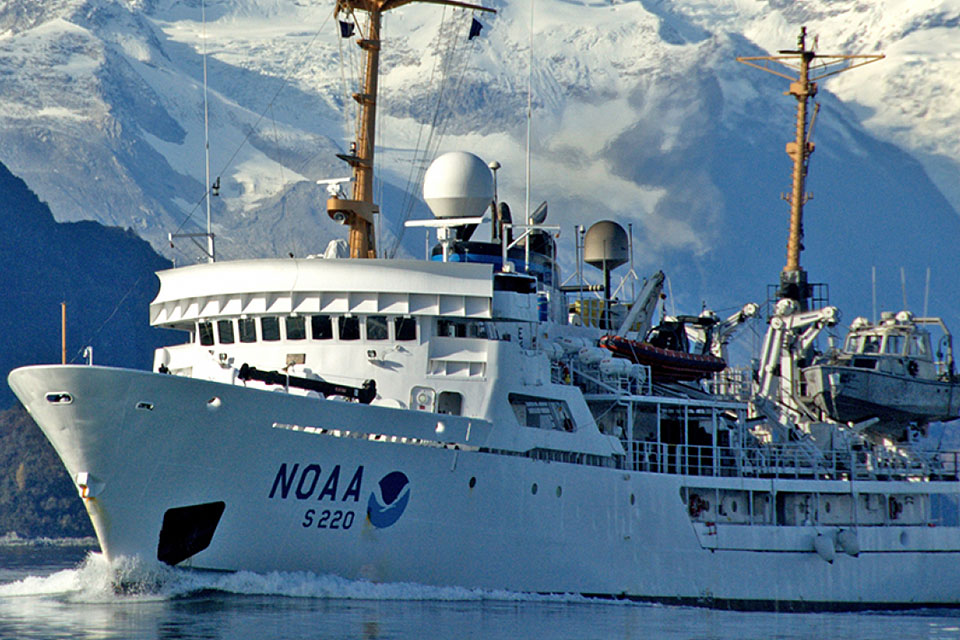
NOAA ship Fairweather, shown here preparing to survey maritime routes along the west coast of Alaska, is one of several NOAA ships used to map the seafloor. NOAA's Office of Coast Survey collects survey data in U.S. waters to measure the depth and bottom configuration of water bodies to update nautical charts. This data contributes to the Seabed 2030 effort.
As of summer 2022, 23.4 percent of the ocean is mapped, reflecting an increase of 10.1 million square kilometers (almost 3.9 million square miles) of new bathymetric data from 2022. The new number represents contributions from a wide and diverse group of stakeholders, including various nations, government agencies, private companies, philanthropic partners, and academic institutions.
In many locations, seabed mapping is done close to shore to enhance national security or protect a particular country’s economic interests. NOAA's mission — to understand and predict our changing environment, from the deep sea to outer space and to manage and conserve U.S. coastal and marine resources — makes participation in Seabed 2030 a natural fit. As a part of the Department of Commerce, NOAA holds key leadership roles in shaping international ocean, fisheries, climate, space, and weather policies.
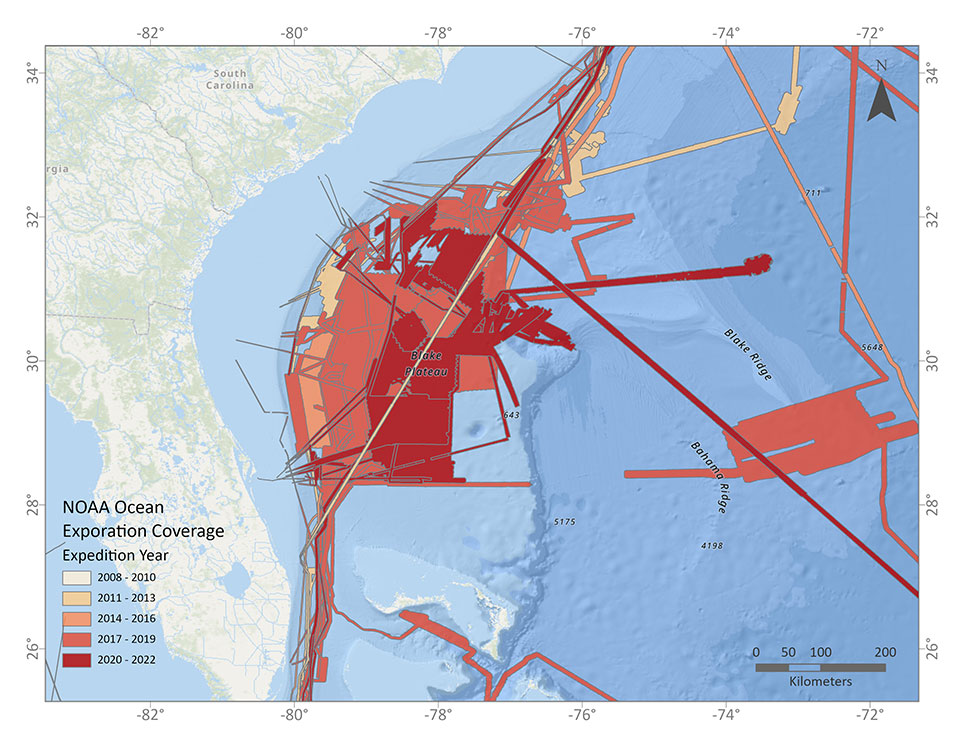
This image shows NOAA Ship Okeanos Explorer mapping data collected in the Blake Plateau and Ridge region since 2010. The process to collect NOAA surveying data involves drawing lines on a computerized chart to direct the ship's driver where to go. Once the ship collects data along one line, it overshoots the area and loops back around in the opposite direction to collect the data on the next line. Participants on a multibeam mapping cruise often refer to this as "mowing the lawn." Credit: NOAA Office of Ocean Exploration and Research
Seabed 2030 is a collaborative project that aims to bring together all available bathymetric data to produce the definitive map of the world ocean floor by 2030. The project is aligned with the UN's goal to conserve and sustainably use the ocean and marine resources. Fishing, recreational, and commercial vessels worldwide are invited to submit data collected using standard navigation instruments.
 An official website of the United States government.
Social