U.S. flag An official website of the United States government.

dot gov icon Official websites use .gov

A .gov website belongs to an official government organization in the United States.

https icon Secure websites use HTTPS

A small lock or https:// means you’ve safely connected to a .gov website. Share sensitive information only on official, secure websites.

2022 Sea Level Rise Technical Report: Infographics

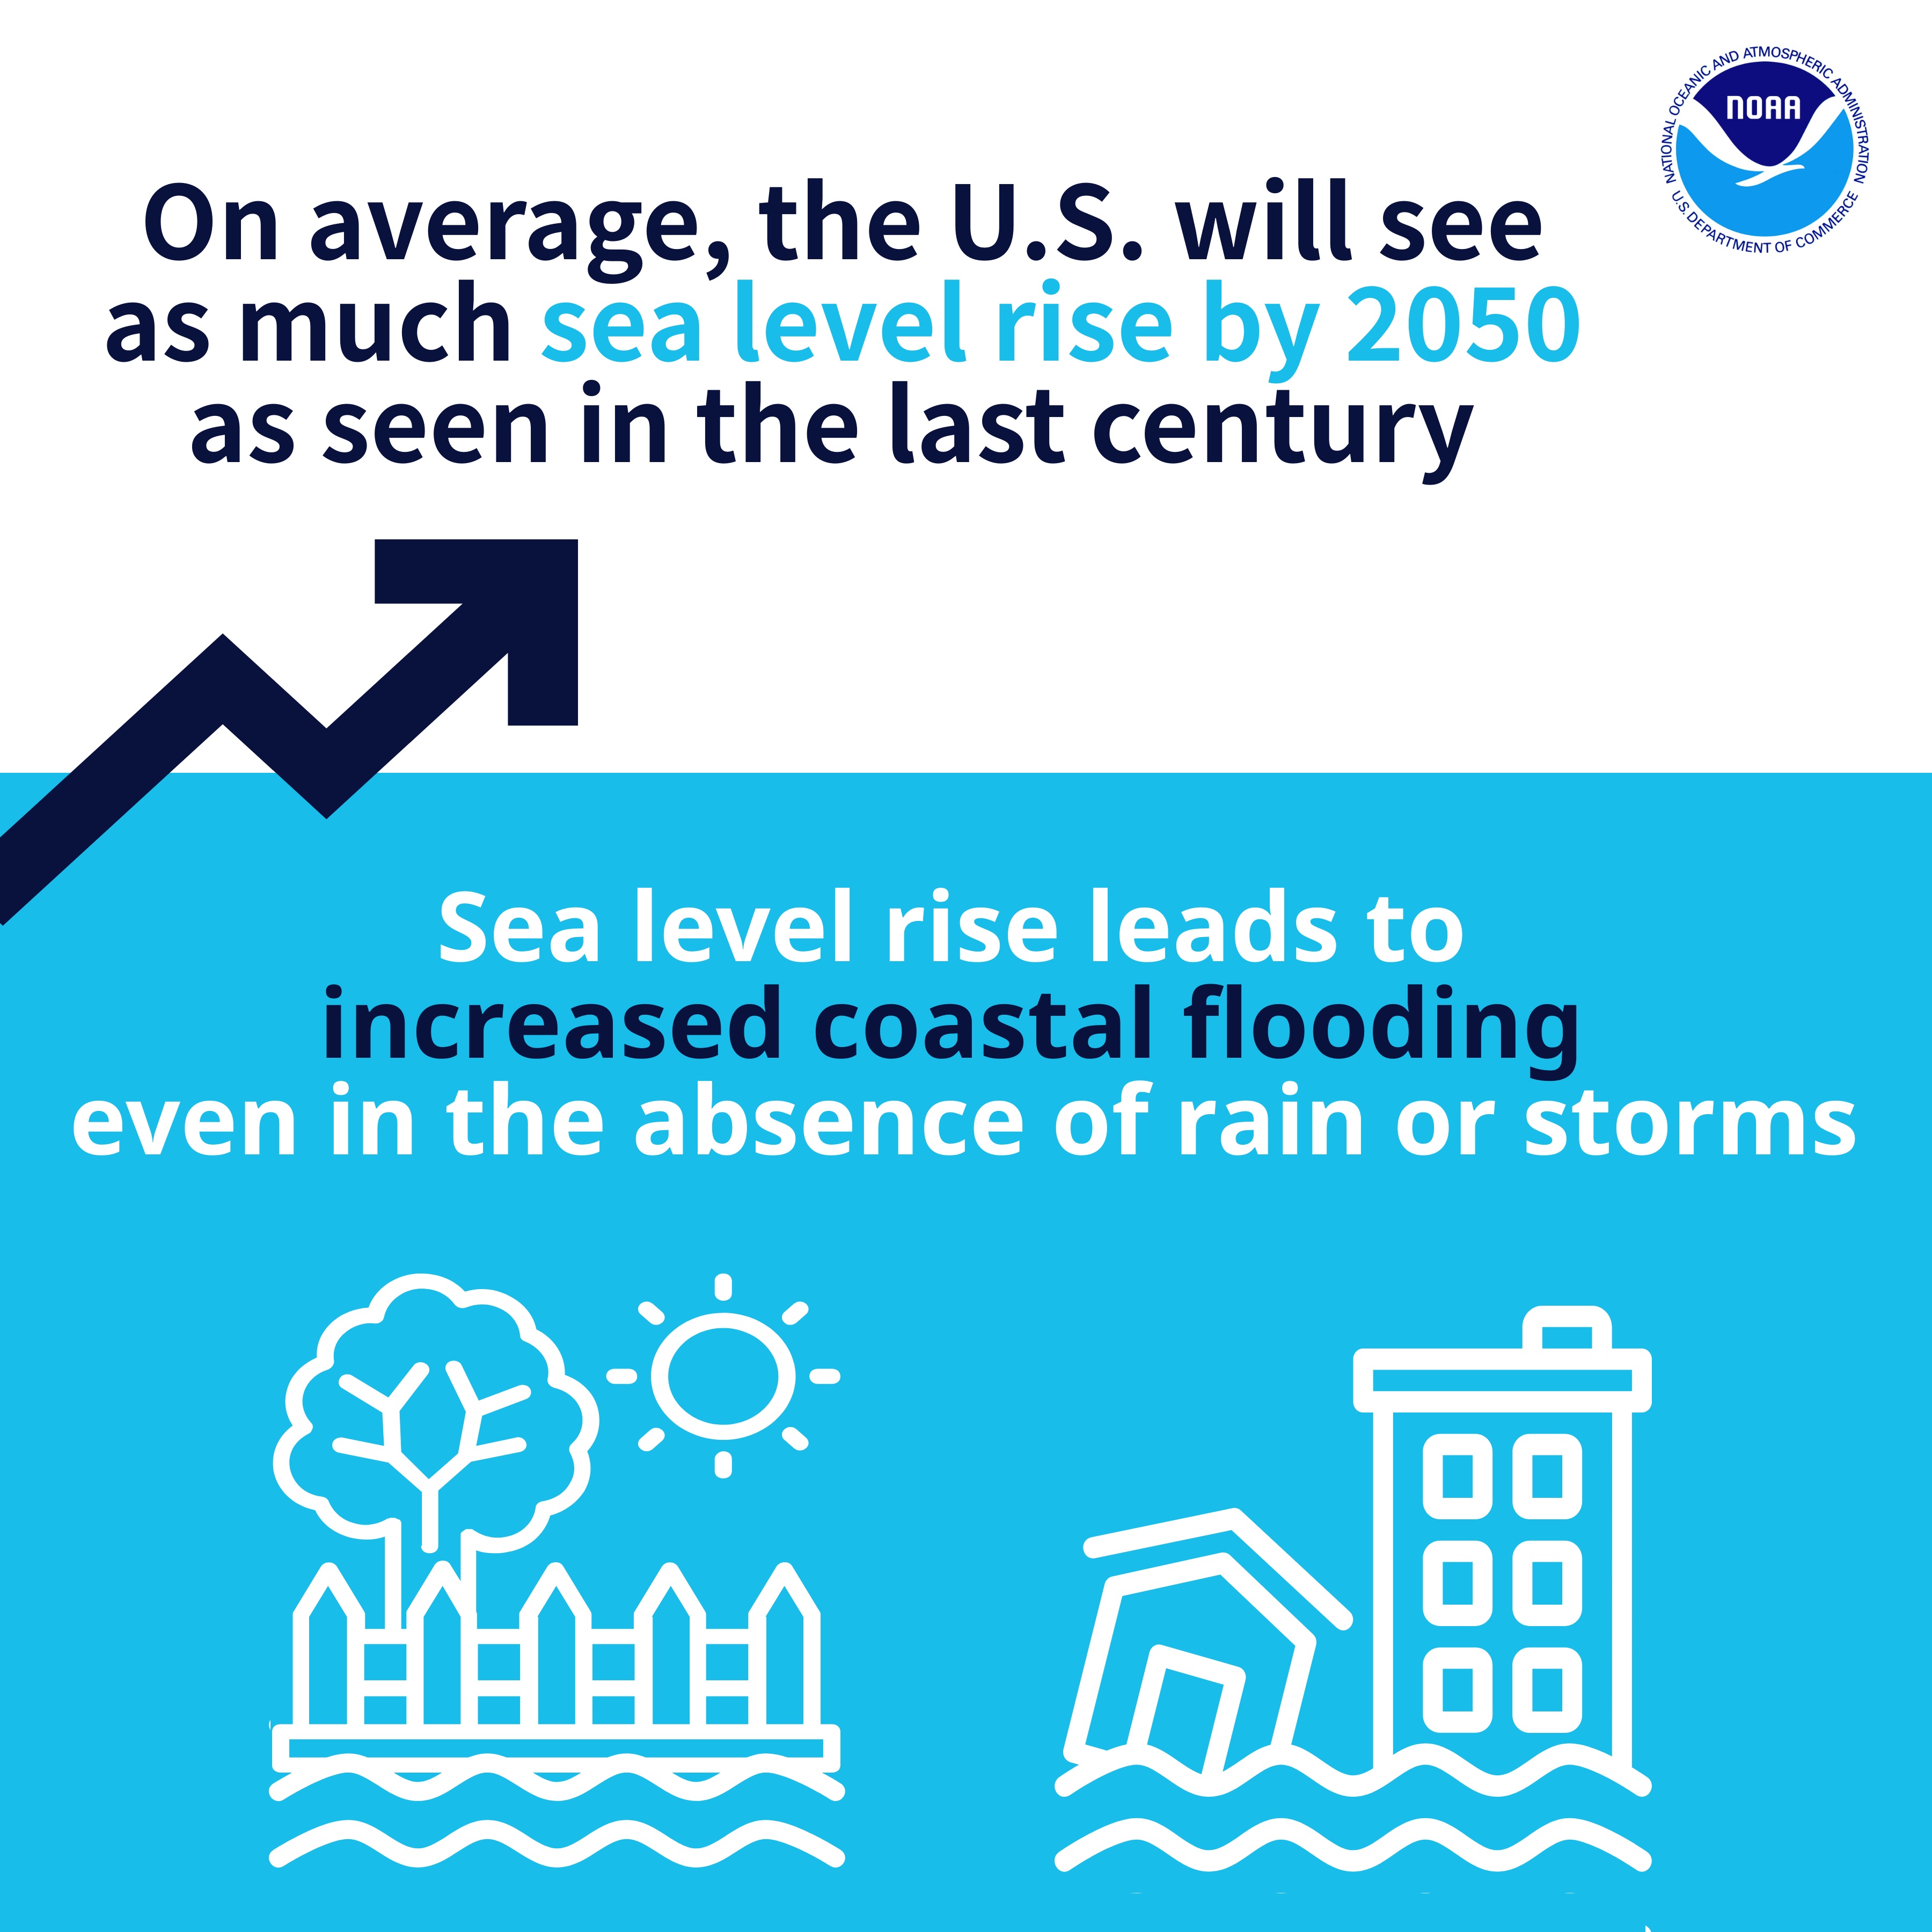
Slide depicting sea level rise predictions by 2050. Full transcript available in caption link.

Key Takeaways: On average, the U.S. will see as much sea level rise by 2050 as seen in the last century. Sea level rise leads to increased coastal flooding, even in the absence of heavy rain or storms.

A transcript is available that presents this infographic in plain text. | Download a copy of this infographic.

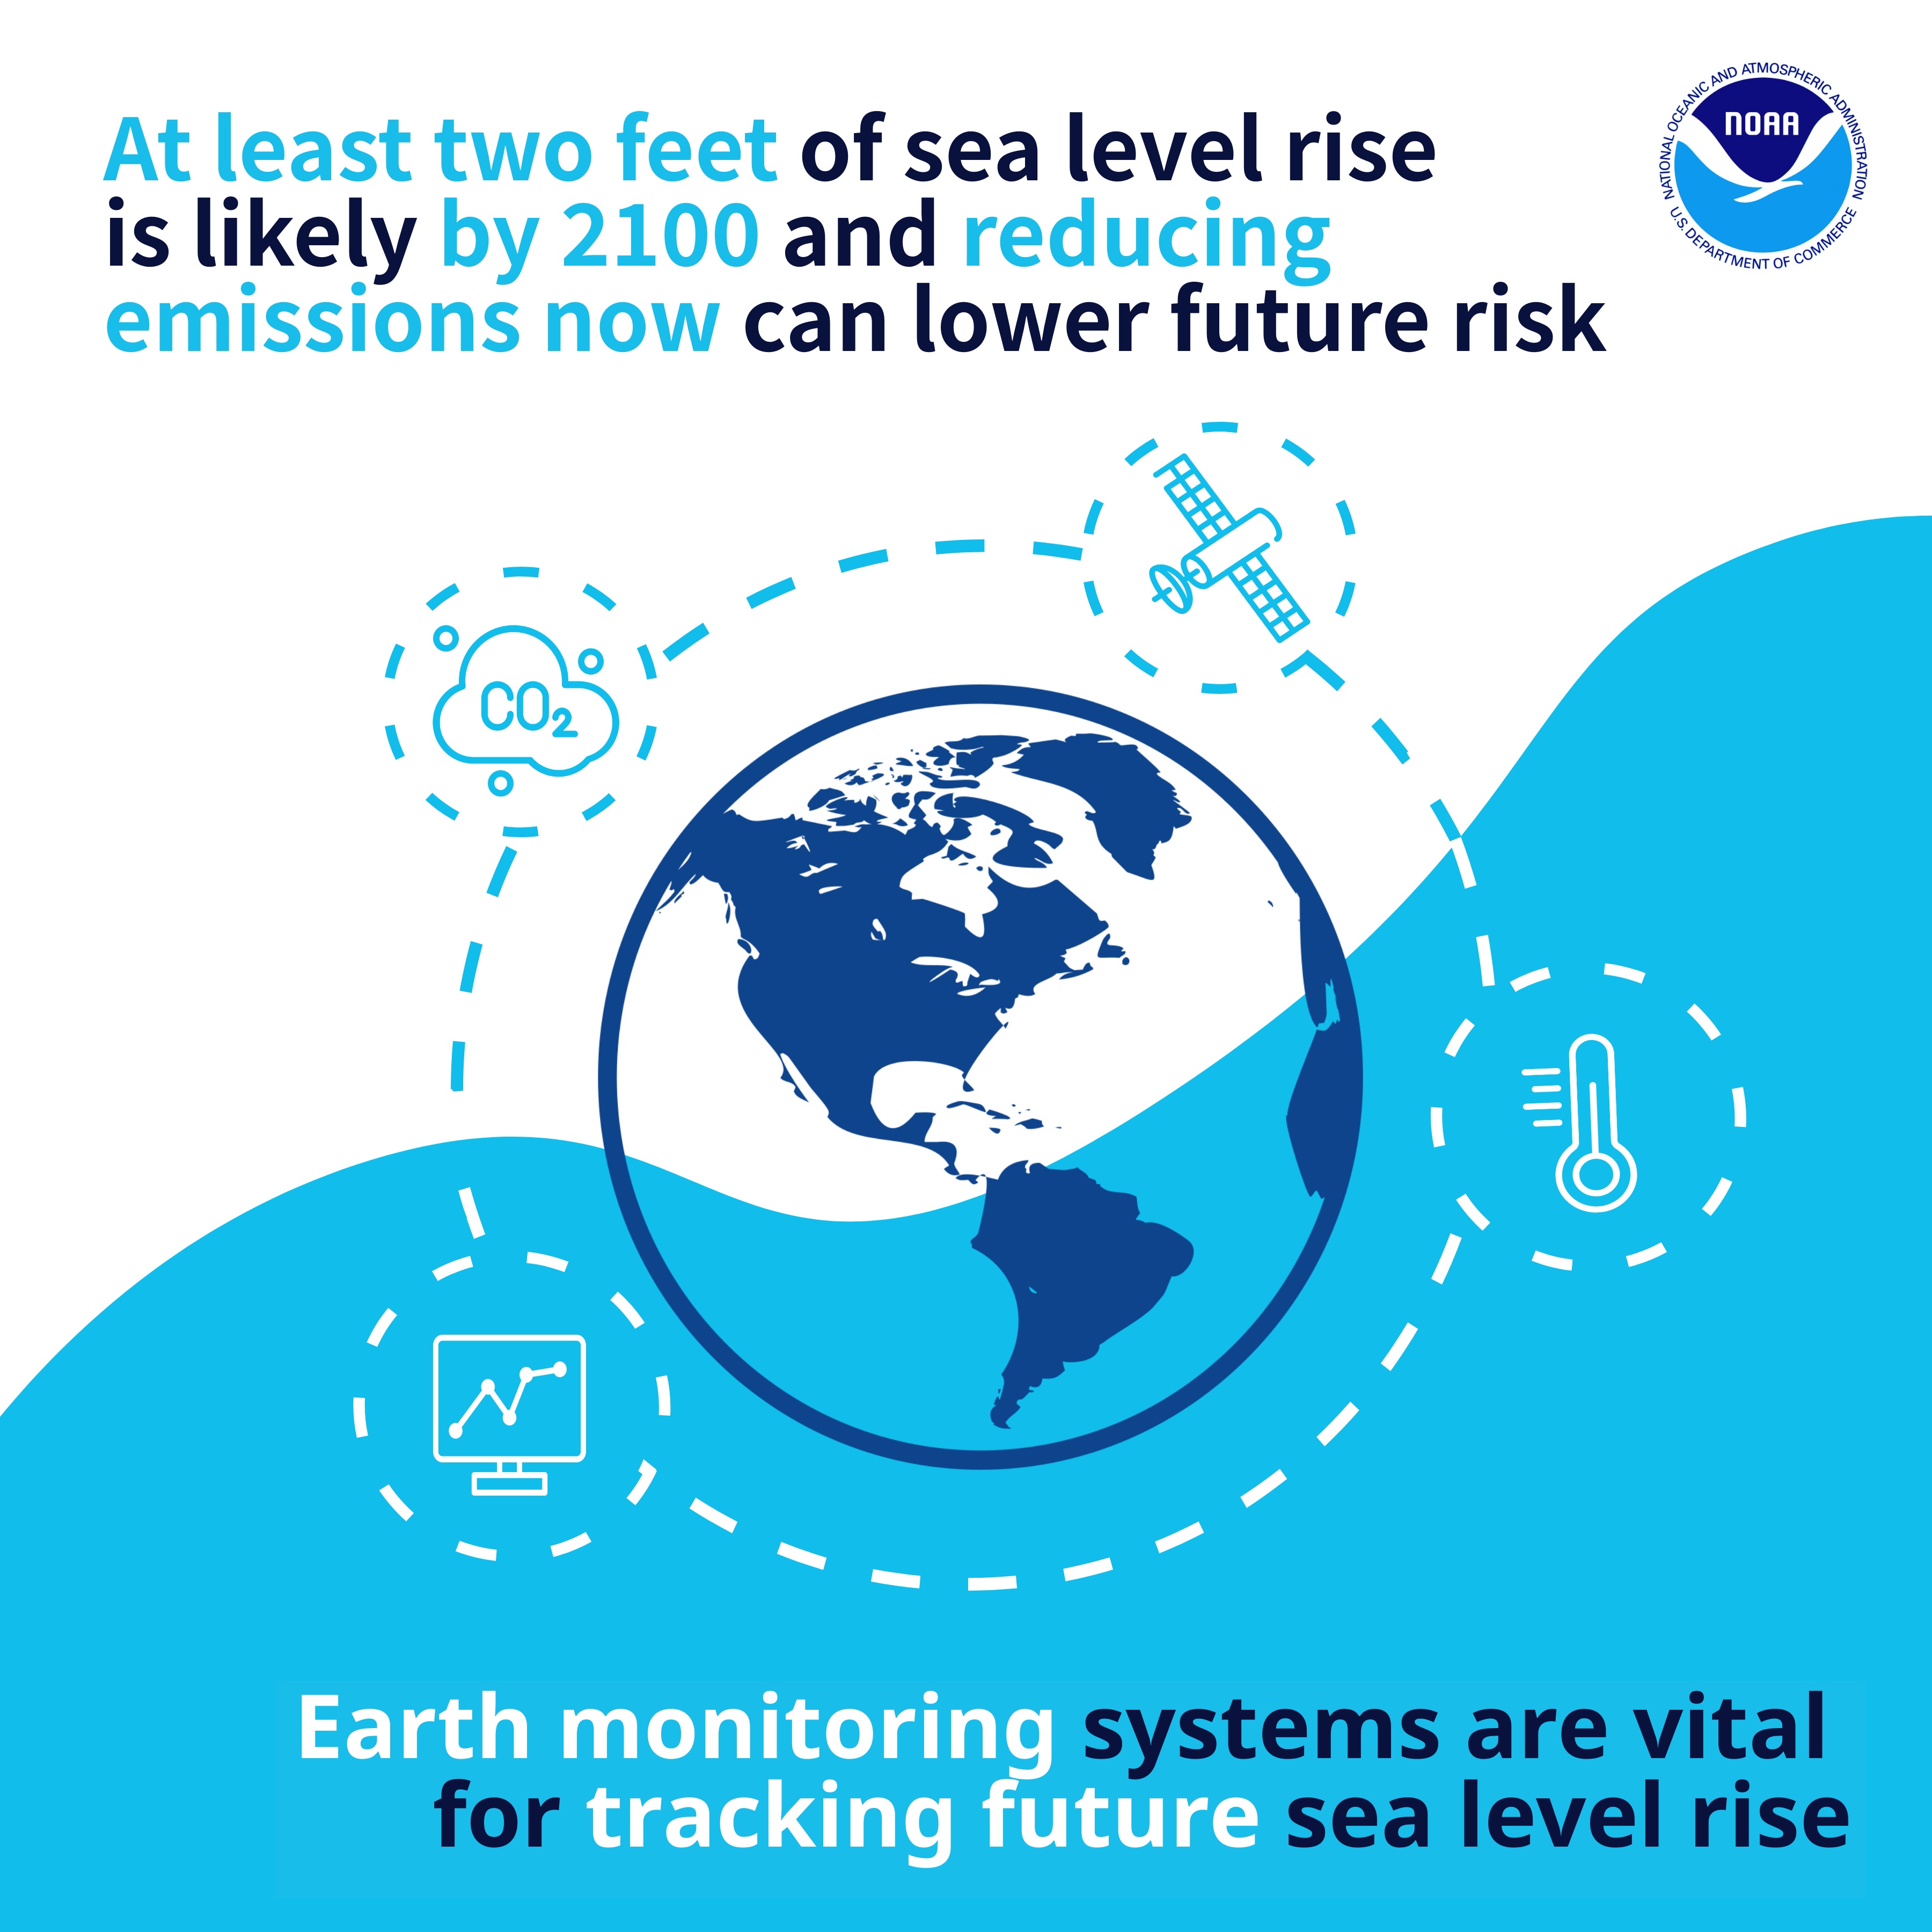
Slide depicting sea level rise predictions by 2100 and how reducing emissions can help lower fisk. Full transcript available in caption link.

Key Takeaways: At least two feet of sea level rise is likely by 2100 and reducing emissions now can lower future risk. Earth-monitoring systems are vital for tracking future sea level rise.

A transcript is available that presents this infographic in plain text. | Download a copy of this infographic.


Infographic One Transcript

  • The image shows a white and blue background overlaid with navy text.
  • A jagged arrow pointing upward toward the center of the text reads: “On average, the U.S. will see as much sea level rise by 2050 as seen in the last century. Sea level rise leads to increased coastal flooding, even in the absence of heavy rain or storms.”
  • Icon 1 is located underneath this text on the lower left and shows the sun shining over a bushy tree and white picket fence, both inundated by water.
  • Icon 2 on the lower right shows higher waves of water knocking a small house sideways into a high-rise building.

Infographic Two Transcript

  • Text at the top of the image reads: “At least two feet of sea level rise is likely by 2100 and reducing emissions now can lower future risk.”
  • Underneath this text is an icon of a blue Earth with a background wave. The wave begins low on the left side and rises toward the right side.
  • Two icons surrounding the Earth show a thermometer and a carbon dioxide cloud, which are meant to convey that emissions play a part in sea level rise.
  • An additional two icons display a computer monitoring sea level rise and a satellite tracking Earth from above. They are all encompassed in a white and blue dotted line to signify they are linked.
  • Text at the very bottom of the image reads: “Earth-monitoring systems are vital for tracking future sea level rise.”