U.S. flag An official website of the United States government.

dot gov icon Official websites use .gov

A .gov website belongs to an official government organization in the United States.

https icon Secure websites use HTTPS

A small lock or https:// means you’ve safely connected to a .gov website. Share sensitive information only on official, secure websites.

2022 Sea Level Rise Technical Report

Download Report by Section

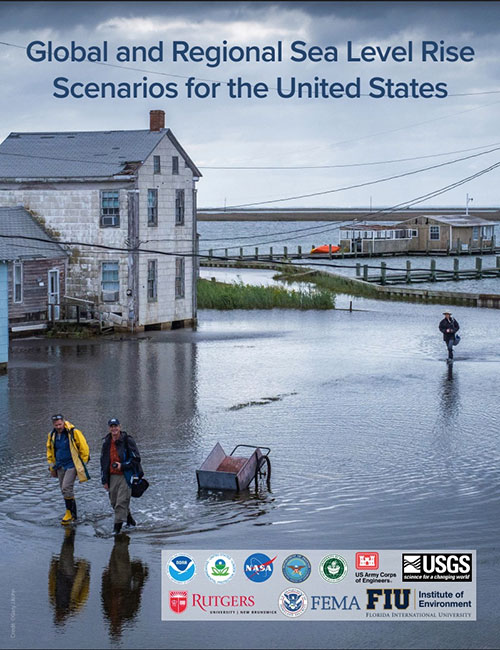
front page of 2022 sea level rise technical report

When it comes to incorporating sea level rise projections into community planning initiatives, the path is not crystal clear, as there are many factors to consider. Our companion Application Guide for the 2022 Sea Level Rise Technical Report helps the reader wade through the considerations and arrive at what’s best for their community.

Frequently Asked Questions:

  • When it comes to incorporating sea level rise projections into community planning initiatives, the path for each community, for each project, is not crystal clear, as there are many factors to consider. That’s what this application guide helps the reader do — wade through the considerations and arrive at what’s best for their community. This publication is a companion for the 2022 Sea Level Rise Technical Report, which represents the most up-to-date sea level rise information available. The application guide includes four sections:

    1. A description of the content within the technical report.
    2. An in-depth discussion of items to be considered when planning for sea level rise.
    3. Approaches for integrating the 2022 sea level rise scenarios into community planning initiatives.
    4. Additional resources to be used as communities explore next steps.

Frequently Asked Questions

This technical report provides a synthesis of the most recent science related to sea level rise, and serves as a key technical input for the Fifth National Climate Assessment that is underway. The report does not provide guidance or design specifications for a specific project, but is intended to help inform federal agencies, tribes, state and local governments, and stakeholders in coastal communities about current and future sea level rise. The executive summary provides key messages, and the body of the report provides detailed, technical information about the data, modeling, and analysis behind the report’s findings. As with the previous 2017 technical report, global mean sea level rise scenarios are regionalized for the U.S. coastline.

Data from the report are being incorporated into current and planned agency tools and services, and are immediately available in NOAA’s Sea Level Rise Viewer and NASA’s Task Force Projection Tool. Readers interested in accessing information for a particular community or region can look to these tools.

Frequently asked questions and answers are available below.

Impacts and Causes of Sea Level Rise

Tens of millions of people in the U.S. and hundreds of millions globally live in areas that are at risk of coastal flooding. Sea level rise does not act alone — rising sea levels, along with sinking lands, will combine with other coastal flood factors like storm surge, wave effects, river flows, and heavy rains to significantly increase the exposure of coastal communities, ecosystems, and economies. Sea level rise threatens infrastructure necessary for local jobs, regional industries, and public safety, such as roads, subways, drinking water supplies, power plants, oil and gas wells, and sewage treatment systems.

Long-term sea level rise will affect the extent, frequency, and duration of coastal flooding events. High-tide flooding events that occur only a few times a year now may occur once a month, or once a week in the coming decades. These same water level changes may also increase coastal erosion and groundwater levels. Elevated groundwater levels can lead to increased rainfall runoff and compromised underground infrastructure, such as public utilities, septic systems, and structural foundations. Higher water levels also mean deadly and destructive storm surges, wave impacts, and rainwater are unable to drain away from homes and businesses.

See Section 1.1 of the technical report for more information.

The two major causes of global mean sea level rise are the expansion of ocean water as it warms (thermal expansion) and the added water from land-based ice (e.g., mountain glaciers and ice sheets) as it melts. Both of these processes are driven by increased global temperatures that are associated with greenhouse gas emissions. At a local level, any vertical land motion that may be occurring — from either natural or anthropogenic factors — can cause changes in ‘relative sea level.’

See Section 1.1 of the technical report for more information.

There is strong evidence in the geologic record that global carbon dioxide levels, temperature levels, and sea levels have changed together through time. Human activities, especially emissions of greenhouse gasses, are the dominant cause of increasing global temperatures since the industrial revolution. When concentrations of greenhouse gasses in the atmosphere go up, temperatures also go up. As Earth warms, the ocean warms too, absorbing more than 90% of the increased atmospheric heat. When water warms, it expands — a process known as thermal expansion. This thermal expansion means that the volume of ocean water increases, which causes sea levels to rise. Rising air and ocean temperatures also cause glaciers and ice sheets to melt, which in turn increases the amount of water in the ocean. Both thermal expansion and melting land-based ice cause sea level to rise. Because the ocean is so large it retains heat for a long time. This means that even if global emissions and temperatures are reduced, sea levels will continue to rise for the coming decades and centuries.

See Section 1.1 of the technical report for more information.

Global sea level rise is caused by expanding ocean water and melting of land-based ice (see Questions 2 and 3). Regionally, other factors are at play, which means that there are differences in the amount and speed of sea level rise that will be experienced in each region of the United States. Regional or relative sea level rise has three drivers: changes in the ocean’s characteristics (stereodynamics), changes in the land’s height (vertical land motion), and changes in land ice and Earth ( gravitational, rotational, and deformational changes).

The first driver, stereodynamic sea level change, refers to changes in the ocean’s movement (circulation and currents) and its climate (temperature and saltiness). Trade winds and currents can push water higher, or lower, in different regions. Freshwater added from melting ice sheets and glaciers can shift ocean circulation patterns in different regions by changing the saltiness, temperature, and density of the water.

Another reason for differences in regional sea level is vertical land motion. Across the U.S., land is sinking or rising at different rates and times, and this affects how high sea level rises in a region. Vertical land motion can be a result of geologic processes (e.g. the movement of tectonic plates); human activity, such as removing groundwater or fossil fuels from underground, which can cause the land to sink; or naturally-occurring sediment compaction and settling over time (e.g., subsidence in the Mississippi River delta).

Changes in land ice and solid Earth – also called gravitational, rotational, and deformational changes – can also affect regional sea level. When ice sheets and glaciers melt or lose mass, this adds freshwater to the oceans and changes the gravity, deformation, and rotation of the Earth, which then contributes to higher sea level rise at locations farther away from the ice melting source than locations close by. These patterns of sea level rise are known as “fingerprints” and are the reason that ice mass loss from distant Antarctica will impact the U.S. coastline more so than ice mass loss from Greenland.

See Section 2.1 of the technical report for more information.

Global mean sea level, or the average height of the ocean surface, has risen 6 - 8 inches (15 - 20 centimeters) since 1920. In the continental U.S., relative sea level has risen about 10 - 12 inches (25 - 30 centimeters) over the same period. Observational data from tide gauges and satellites also show that sea level rise, both globally and along the continental U.S., is accelerating, with more than a third of that rise having occurred in the past two and a half decades (see NOAA and NASA portals for altimeter-based global rates and NOAA for local tide gauge rates).

Sea Level Rise Scenarios

Sea level rise scenarios represent possible future sea level changes in response to increasing greenhouse gas emissions and ocean and atmospheric warming. These scenarios allow people to consider future impacts and responses and ask “what if?” questions about the future to support planning and decision-making. Sea level rise scenarios are used to communicate how much sea level rise could occur, under what circumstances, and by when. They also show how sea level rise might occur globally and locally.

Sea level rise scenarios are generally based upon climate model outputs. These climate models allow scientists to simulate different responses, such as how the ocean might continue to warm, where ice melts and major ice sheets dynamically respond, and where and how the additional water disperses around the world’s ocean and affects circulation patterns. These responses differ under models that use different bounding conditions associated with various amounts of greenhouse emissions and ocean and atmospheric warming projections. Thus sea level rise scenarios help us plan in the face of uncertainty by providing a range of possible futures that help represent a) potential future human-driven greenhouse gas emissions, and b) how earth’s physical processes will respond to increased temperatures.

Shared socioeconomic pathways describe how society, economics, and demographics may change globally over the next century. Depending on which pathway our global community actually follows, the amount of warming — and hence the amount of sea level rise — could be very different. These shared socioeconomic pathways are used in the Intergovernmental Panel on Climate Change’s Sixth Assessment Report, released in 2021.

Representative concentration pathways are another frame of reference for evaluating future climate changes and were used in the Intergovernmental Panel on Climate Change’s Fifth Assessment Report. Representative concentration pathways represent different amounts of net radiative forcing by the end of the 21st century — in other words, the extra heat trapped in the atmosphere due to future amounts of greenhouse gasses — but the pathway of emissions or social conditions to get there are not specified.

In the 2017 sea level rise technical report, scenarios were related to representative concentration pathways. The 2022 report and data employ the underlying methods and output from the Sixth Assessment Report and their dependency on shared socioeconomic pathways, but focus more on how these scenarios relate directly to different amounts of end-of-century surface warming associated with the pathways (see Question 3).

See Section 2.4 of the technical report for more information.]

There are two types of uncertainty that are important to consider when thinking about future sea level changes: 1) uncertainty in representing or modeling the physical processes that cause sea level change known as process uncertainty, and 2) uncertainty in how human behavior will drive future emissions and ensuing warming known as emissions uncertainty. The suite of projections in this report captures both process uncertainty and emissions uncertainty.

Process uncertainty is associated with how well we currently understand why sea level has changed in the past and how it will change in the future at specific times and locations. To capture process uncertainty in sea level rise projections, there is a range of uncertainty around each individual scenario (i.e., the low/17th%, median/50% and high/83rd% values for each particular scenario). The farther forward in time we move, the greater the uncertainty around each projection.

Emissions uncertainty is captured in the range between the five global mean sea level rise scenarios: Low (1 foot; 0.3 meters), Intermediate Low (1.6 feet; 0.5 meters), Intermediate (3.3 feet; 1.0 meter), Intermediate High (4.9 feet; 1.5 meters), and High (6.6 feet; 2.0 meters). In other words, the range between the five sea level scenarios is closely connected to emissions uncertainty, while the range around a given scenario is associated with process uncertainty.

In addition to process and emissions uncertainty, there is still scientific discussion and investigation underway on the potential for rapid ice sheet melt and collapse, sometimes referred to as low confidence processes. Currently there is no scientific consensus on whether rapid melt will occur and, if it does, what that process will look like. Given that it is possible, those processes are included in international and federal assessments. The possibility of rapid ice sheet melt is a significant driver in reaching the highest scenarios in the 2022 technical report.

We know that throughout time, global sea levels have changed by tens to hundreds of meters over approximately 100,000-year cycles. And that in arriving at the stages of sea level equilibriums (the dips and humps of global sea levels through time), there is evidence of periods of rapid rise on the order of meters of rise over 100-year periods. Due to the “committed sea level rise” from continued warming of the ocean, over the course of the next several centuries the higher scenarios might be approached as “when, not if” if warming and emissions continue to rise unchecked. Or, put another way, there is uncertainty in how quickly the “dynamics” associated with ice sheets may affect future sea level rise, but not regarding whether or not global sea levels in the next several centuries will rise by at least a few meters.

See Section 2.2.2 and Box 2.1 of the technical report for more information on uncertainty in sea-level rise.

Components of the Report and Changes to the Sea Level Rise Scenarios Since 2017

The report has three main components:

  1. Updated scenarios of global and regional sea levels out to the year 2150.
  2. A focus on the near-term time period using observation-based trajectories out to 2050.
  3. A new national gridded set of extreme water level probabilities that illustrate how the frequency of NOAA minor, moderate, and major high tide flooding events will change in frequency out to year 2050 (See the questions on Observation-Based Extrapolations and Extreme Water Levels).

The 2022 technical report includes five possible scenarios of global sea level rise by 2100: Low (1 foot; 0.3 meters), Intermediate Low (1.6 feet; 0.5 meters), Intermediate (3.3 feet; 1.0 meter), Intermediate High (4.9 feet; 1.5 meters), and High (6.6 feet; 2.0 meters). These same scenarios were in the 2017 technical report, but the Extreme (8.2 feet; 2.5 meters) scenario included in 2017 has been removed (see Question 14).

The 2100 projections for each global scenario stayed the same, since science suggests this range of futures remains possible. However, the timing for different rates of rise for the different scenarios was updated based on new modeling and more realistic assumptions of Greenland and Antarctic ice sheet behavior based upon the Intergovernmental Panel on Climate Change Sixth Climate Assessment. A result is that there is less acceleration in the higher scenarios until about 2050 and greater acceleration toward the end of this century. This has two primary implications. First, despite maintaining the same target values and having the same range between scenarios in 2100, the range covered by the scenarios is smaller in the near term than in the 2017 report. Second, the likely (17th-83rd percentile) ranges of projections for each scenario before and after the 2100 time point used to define the scenarios are wider than in the 2017 report.

See Section 2.2.3 of the technical report for more information.

A goal of the 2017 and 2022 technical reports is to examine the full range of plausible amounts of future global sea level rise, not just those rise amounts considered “likely.” Quantifying the “unlikely but possible” sea level rise response can be critical to help bound certain risk planning exercises. For global mean sea level, these hinge on potential physical changes in the major ice sheets, where possible rapid collapses would contribute to very large amounts of future sea level rise. These “unlikely but possible” outcomes must be acknowledged and accounted for in some types of planning (e.g., for major infrastructure investments that have a very long operational life cycle and/or are critical community lifelines.) For the 2017 report, these considerations led to the development of a set of global mean sea level scenarios that span the plausible range of sea level rise and are defined by a target value of rise in 2100. In the 2022 report, the same framework is adopted, and the following 2100 target values of sea level rise are used to differentiate the five scenarios: Low (1 foot; 0.3 meters), Intermediate-Low (1.6 feet; 0.5 meters), Intermediate (3.3 feet; 1 meters), Intermediate-High (4.9 feet; 1.5 meters) and High (6.6 feet; 2 meters).

To create the global mean sea level scenarios and associated regional relative sea level values, the 2022 technical report used the last report in 2017 as a starting point. The scenarios from that report are updated with the most recent science and adopted analytical methods from the Intergovernmental Panel on Climate Change's (IPCC) Sixth Assessment Report, completed in 2021. The IPCC regularly convenes top researchers from around the world to synthesize the best available climate science. Both the technical report and the IPCC Sixth Assessment Report draw upon the latest sea level rise science. Because both reports depend upon the same underlying science, they are similar and consistent, but the global mean sea level scenarios lead to a different framing and structure. To generate the scenarios used in this report, the ensemble — or set — of projections in the Sixth Assessment Report that are tied to specific shared socioeconomic pathways (see Question 7) are filtered to identify subsets of pathways that are consistent with the scenario target values in 2100 (i.e., 0.3 meters, 0.5 meters, 1 meter, 1.5 meters and 2 meters). As in the Sixth Assessment Report, these scenarios are regionalized and then provided at individual tide gauge locations and for 1-degree grids along the global and U.S. coastlines. The median, 17th and 83rd percentile values are provided for each scenario at each tide gauge and grid location.

See Section 2.2.3 of the technical report for more information.

Sea level along the contiguous U.S. coastline is expected to rise (considering alignment of both the observation-based trajectories and the scenarios in 2050), on average, 10 - 12 inches (0.25 - 0.30 meters) in the next 30 years (2020-2050). This will vary locally because of regional factors (see Question 4). Rise in the next three decades is anticipated to be, on average:

  • East coast: 10 - 14 inches (0.25 - 0.35 meters)
  • Gulf coast: 14 - 18 inches (0.35 - 0.45 meters)
  • West coast: 4 - 8 inches (0.1 - 0.2 meters)
  • Caribbean islands: 8 - 10 inches (0.2 - 0.25 meters)
  • Hawaii islands: 6 - 8 inches (0.15 - 0.2 meters)
  • Northern Alaska coast: 8 - 10 inches (0.2 - 0.25 meters)
  • Pacific islands, Southern Alaska coast, and other locations not listed: see Question 19 for how to access location-specific data

See Section 2.3 of the technical report for more information.

With each passing year, improved observations and modeling help us get a clearer picture of how and when sea level is changing both globally and regionally (see Questions 3 and 4). The scenarios in the 2022 technical report are lower in the near-term decades than they were in the 2017 technical report because there is improved understanding of Antarctic and Greenland ice sheet dynamics (see Question 10). This improved understanding comes from additional observations, research, modeling, and expert elicitation efforts that indicate sea level rise will be slower in the next few decades than previously projected. The 2022 technical report removes the Extreme (2.5 meter) scenario because the probability of this scenario is now thought to be too low to merit inclusion.

See Section 2.2.3 and 2.3 of the technical report for more information.

Since 2017, scientists have worked hard to study and develop better modeling of both Greenland and Antarctic ice sheets, and of how these two ice sheets generate different sea level changes across the globe because of how ice mass loss results in changes in gravitational, rotational, and deformation effects. The combination of these effects is referred to as “fingerprinting,” and Greenland and Antarctic ice sheets have very different “fingerprints” (see Question 4). Locations far away from a sheet see greater amounts of sea level rise when ice mass is lost from that sheet, so it really matters which sheet is melting, how much, and when. The 2022 report uses the latest science and multiple methods to characterize ice sheet processes in both Antarctica and Greenland, and the result is a more realistic projection of global mean sea levels over time. Due to improved characterization of Greenland’s potential increased contributions for the higher scenarios (Intermediate to High), this change results in projections of less rise along many U.S. East and Gulf locations through 2100. However, it is important to keep in mind that sea levels will continue to rise after 2100; the new projections just indicate we have more time to prepare.

Sea level scenarios will continue to be refined as scientists increasingly observe and learn more about the details of dynamic earth system processes (e.g., Antarctic ice sheet response to temperature increases.) Additional data will help to reduce uncertainty. U.S. federal agencies monitor and assess key sea level rise source contributions globally and along U.S. coastlines, and this work can provide early indications of change in the trajectory of sea level rise, which can inform shifts in adaptation planning.

The 2022 technical report further refines and narrows the possible range of scenarios from the 2017 report. Assessment reports like this are the best resource for staying up-to-date on the latest changes to the sea level rise scenarios and why those changes have occurred. These reports are anticipated about every five years.

Observation-Based Extrapolations and Extreme Water Levels

Observation-based extrapolations, or sea level rise “trajectories,” are estimates of relative sea level rise out to 2050. These are built by analyzing regional sets of tide gauge data. To create them, the rate and acceleration of sea level rise from 1970 to 2020 is calculated from sea level rise observations from regional sets of tide gauges. Filtering is done to remove some effects of natural variability that can bias trend characterizations, such as El-Nino/La-Nina cycles. For the global sea level rise extrapolation, satellite-based water elevation data (altimetry) was also included.

Included in the 2022 technical report for the first time, observation-based extrapolations are provided for global sea level and eight coastal regions (the Northeast, Southeast, Eastern Gulf, Western Gulf, Southwest, Northwest, Hawaiian Islands, and the Caribbean). Separate extrapolations are also provided for the southern and northern coasts of Alaska and the Pacific islands but caveated with greater uncertainty due to variations in land elevation and underlying regional sea level rise processes.

These observation-based extrapolations are very similar to the model-based projections through 2050, and therefore serve as a further line of evidence for the confidence in the near-term trajectory of sea level rise. Or, put another way, with continued global heating that is expected, there is strong reason to suspect that the current acceleration in sea level rise will continue, and this response is similar in both the observation trends and the modeled scenarios.

See Section 2.2.4 of the technical report for more information.

The technical report uses the term extreme water levels to refer to water levels experienced during a wide range of flooding events, from common events that happen ten times a year to rare events such as a flood with a 1% annual chance of occurring. The extreme water levels are used to assess current and future flood exposure within the coastal floodplain considering future sea level rise using NOAA’s height-severity categories of minor, moderate, and major high tide flooding.

In addition to long-term sea level rise, many different physical processes can affect coastal water levels on much shorter time scales, such as winds and storm surge, tides, and waves. Extreme water levels in this report are specifically those measured by NOAA tide gauges in mostly protected areas, and therefore reflect still water levels without direct wave influences. The extreme water levels generally relate to when coastal water levels exceed specific elevation thresholds related to local flooding hazards. These elevation thresholds are often reflective of flooding events ranging from bathtub-like “nuisance” flooding that is tidally driven to destructive storm-surge flooding whose impact footprint is specific to that storm.

The extreme water levels as defined in this report have probabilities, or likelihoods, of occurring in a given year that are based on statistical analysis of regional sets of historical tide gauge measurements, called a regional frequency analysis. Results based on regional frequency analysis typically suggest that higher water levels are more probable than results based upon a single tide gauge data record. This is because regional sets of data observation better capture spatially the overall probability of a high-water event occurring from a passing storm. The perspective from a single gauge can be rather limited due to storm track variability (storm missed the tide gauge) or short data records (important storms occurred prior to the gauge installation).

The regional frequency analysis extreme water level probabilities are different from those produced and used by FEMA, since FEMA-based estimates often include synthetic storm simulations (i.e., consider storms that could happen under today’s climate but might not yet have happened) and high water marks not necessarily directly measured by a local tide gauge. The different methods produce different probabilities for low frequency flooding (e.g., a 100-year flood), but for more frequent events such as high water levels occurring every few years, the two sets of probabilities are quite similar.

See Section 3 of the technical report for more information.

This report considers extreme water levels that span from rare events (1% annual chance of occurring) to more common events (10 times/year). Specifically, the extreme water levels are used to assess current and future flood exposure within the coastal floodplain considering future sea level rise using NOAA’s height-severity categories of minor, moderate, and major high tide flooding. NOAA high tide flooding thresholds broadly define water levels where U.S. infrastructure becomes impacted. High tide flooding heights are calibrated to impact levels used in weather forecasting to trigger emergency responses and are considered the best tangible way to communicate the impacts of extreme water levels today and in the future to the public. Minor high tide flooding, flooding about 2 feet (0.6 meters) above average high tide, is disruptive to communities where it occurs (e.g., stormwater backups and road closures), whereas moderate flooding, about 3 feet (0.9 meters) above average high tide, tends to cause more damage (e.g., to homes or businesses) and major flooding, which is about 4 feet (1.2 meters) above average high tide, is often quite destructive, requiring post-event repairs/rebuilding and sometimes evacuations.

The report explores how the annual frequencies of high tide flooding are expected to change by 2050 considering the local sea level rise scenario that closely aligns with the rise associated with the regional observation-based extrapolations. The concept of a flood regime shift is used to describe how the annual flood frequency associated with a particular coastal flood type (i.e., NOAA minor, moderate, and major high tide flooding) changes to that of another because of sea level rise. For example, by 2050 the annual frequency of NOAA moderate high tide flooding is expected to occur on average along the U.S coastline at a frequency greater than the NOAA minor high tide flooding events occur today. Or put another way, after about 1 foot (0.3 meters) of sea level rise that is expected to occur on average along the U.S coastline, tides and storm surges that today cause minor and moderate high tide flooding will cause moderate and major high tide flooding.

See Section 3.1 of the technical report for more information.

Accessing Data and Applying Sea Level Rise Information to Decision-Making

Federal agencies have been updating tools with the new sea level rise information, and will continue to do so. The following links include access to report data and updated tools:

A companion Application Guide is available to help users apply and integrate the report into local planning and adaptation decisions. The guide, penned by professionals with expertise on applying sea level rise to local level planning, helps readers wade through considerations and arrive at what’s best for their community. We also have several additional resources available for understanding and applying the updated sea level rise projections.