U.S. flag An official website of the United States government.

dot gov icon Official websites use .gov

A .gov website belongs to an official government organization in the United States.

https icon Secure websites use HTTPS

A small lock or https:// means you’ve safely connected to a .gov website. Share sensitive information only on official, secure websites.
Coastal Hazards

Preparing for the Threats that Face our Coastal Communities

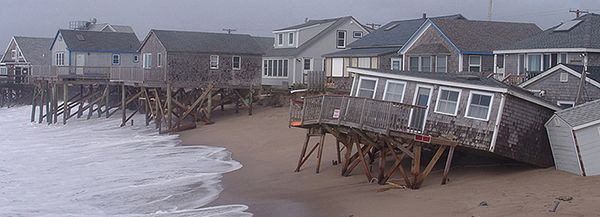
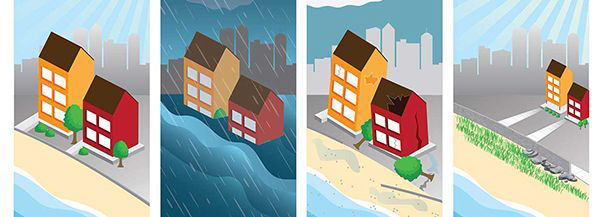
Do you live on or near the coast? The odds are better than 50-50 that you do. In 2010, 52 percent of us lived in one of the nation's 673 coastal counties (excluding Alaska). It's no secret why so many of us choose to live in coastal regions. These are areas of great bounty and beauty. The downside? These areas are also prone to many natural hazards such as erosion, harmful algal blooms, big storms, flooding, tsunamis, and sea level rise.

Local and state governments are on the forefront of the effort to minimize the environmental, social, and economic havoc these hazards can wreak. And NOS is there to provide tools, information, and training to help these agencies keep communities safe and resilient.

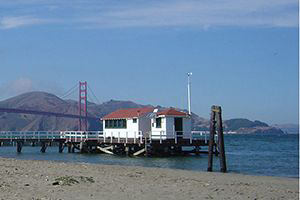
NWLON station in San Francisco, California
Sea Level Rise

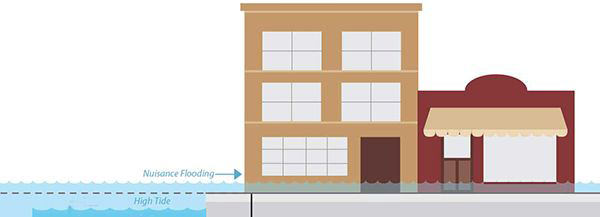
How do scientists keep track of changes in sea level in the U.S.? NOAA's Center for Operational Oceanographic Products and Services maintains the National Water Level Observation Network which includes 210 continuously operating water level stations throughout the U.S. and its territories. The first stations started collecting data in the 1850s. Historical data is used to compute relative local mean sea level trends and to understand the patterns of high tide events.

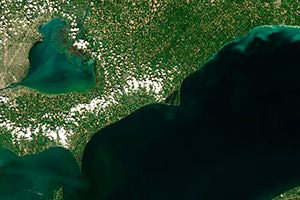
Satellite image of Lake Erie showing a mild harmful algal blom in the southwestern portion of the lake
Harmful Algal Blooms

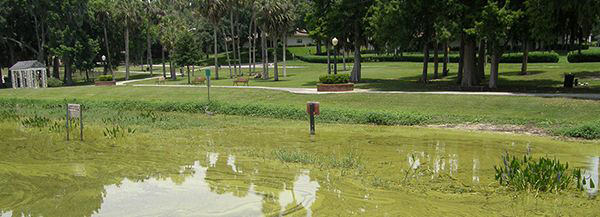
Harmful algal blooms, or HABs, occur when colonies of algae—simple plants that live in the sea and freshwater—grow out of control while producing toxic or harmful effects on people, fish, shellfish, marine mammals, and birds. HABs have been reported in every U.S. coastal state, and their occurrence may be on the rise. HABs are a national concern because they affect not only the health of people and marine ecosystems, but also the 'health' of local and regional economies.

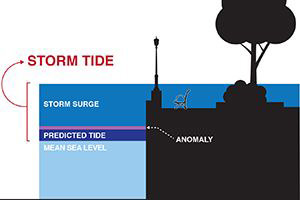
This example illustrates water level differences for storm surge, storm tide, and a normal (predicted) high tide as compared to sea level
Storm Surge

Powerful winds aren't the only deadly force during a hurricane. The greatest threat to life actually comes from the water—in the form of storm surge. Storm surge is the abnormal rise in seawater level during a storm, measured as the height of the water above the normal predicted astronomical tide. The surge is caused primarily by a storm’s winds pushing water onshore. Storm tide is the total observed seawater level during a storm, which is the combination of storm surge and normal high tide.

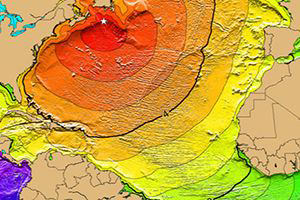
On Nov. 18, 1929, a magnitude 7.4 Mw earthquake occurred 155 miles south of Newfoundland along the southern edge of the Grand Banks, Canada. This illustration, called a Tsunami Time Travel Map, shows the arrival times of tsunami waves. Red: 1-4 hour arrival times; Yellow: 5-6 hour arrival times; Green: 7-14 hour arrival times. The map was produced by NOAA and the International Tsunami Information Center.
Tsunamis

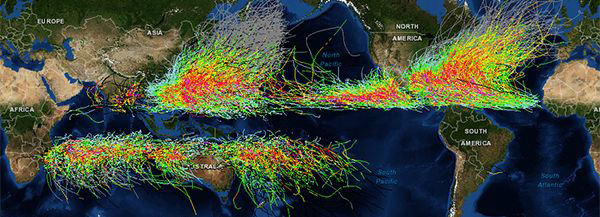
NOS' primary role in tsunami warning is to provide real-time coastal water level data to NOAA's Tsunami Program and the public, which is critical to issuing warnings and forecasts during an event. High-frequency water level information is also important to tsunami modeling, both during and after an event, to refine the forecasts as the event progresses, and to better understand tsunami science for future improvements to the National Tsunami Warning System.