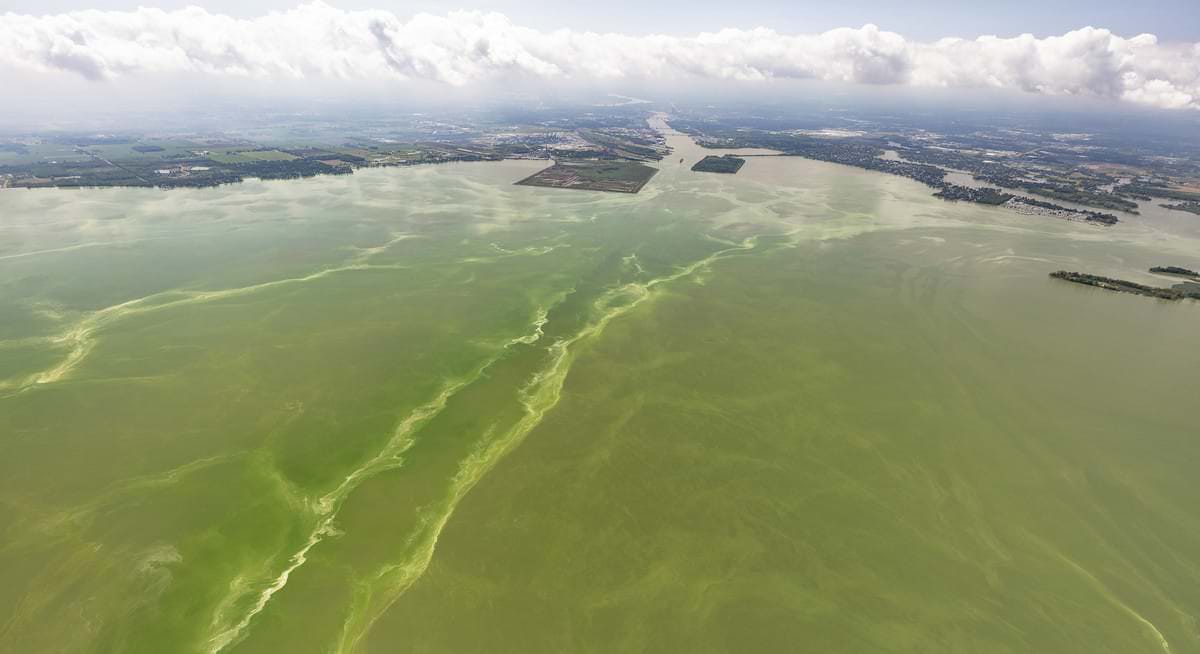
Each summer, warming weather draws mid-Atlantic nature lovers, recreational boaters, and fishing enthusiasts to the shores of Lake Erie. The same change of season creates optimal conditions for rapid growth of algae. While most blooms of algae aren’t harmful, some such as the blue-green algae Microcystis produce toxins that have harmful effects on people, fish, marine mammals, birds, and local economies. Blooms like these are called harmful algal blooms, or HABs.
Lake Erie is more than a summer playground — it’s the primary source of drinking water for all surrounding communities. For these reasons, NOAA produces the Lake Erie HAB Forecast to aid those responding to bloom impacts and help members of the public make informed decisions if a bloom is affecting their area. Since 2016, the Center for Operational Oceanographic Products & Services has issued operational forecasts to supplement seasonal bloom severity projections from the National Centers for Coastal Ocean Science . Users have relied on twice-weekly forecast analysis of bloom position and potential for movement or mixing of surface bloom concentrations, in addition to forecast water currents, and recent satellite imagery.
But many drinking water intakes and prime fishing spots are located below the lake surface, beyond the view of aerial and satellite imagery. To better accommodate the needs of resource managers and tourists alike, the Lake Erie HAB Forecast is now enhanced by the integration of a 3D hydrodynamic model developed by research partners within the Office of Oceanic & Atmospheric Research. Recent satellite imagery is used to produce an estimate of daily Microcystis bloom locations alongside a five-day forecast of bloom movement. Along with these enhancements, the Lake Erie HAB Forecast website has also been redesigned to help users more easily and quickly understand maps and key elements. Bloom movement is also now provided as an animation with plots for vertical movement of Microcystis at select sampling locations.
HABs may continue to affect Lake Erie, but lakeshore communities now have better decision-making tools to help ensure safe drinking water and lake recreational activities.
 An official website of the United States government.
Social