Connecting the Dots with Modeling
NOAA Ocean Podcast: Episodes 47 and 48
What do harmful algal blooms, dust from the Saharan desert, and hurricanes have in common? They are all pieces of the puzzle that modeling puts together to give us the big picture when it comes to studying and understanding our ocean and coasts. In part one of this two-part episode, we take a deep dive into why modeling is important, what kind of data is provided, and how collaboration with stakeholders strengthens our knowledge base. In part two, we continue our conversation about how modeling supports NOAA mission areas and supports coastal communities.

A screenshot of the Chesapeake Bay Operational Forecast System (CBOFS) 3D Water Temperature taken from the U.S. Integrated Ocean Observing System (IOOSⓇ) Model Viewer.
Part One | Transcript
Part Two | Transcript
Transcript: Part One
Transcript: Part One
HOST: This is the NOAA Ocean Podcast. I’m Marissa Anderson.
"Modeling." When this word is mentioned, most of us envision people strutting their stuff on the catwalks or posing in front of a camera. But for NOAA and the National Ocean Service, very different images come to mind.
Modeling is a way for us to see the big picture. Our Earth is really complex and is affected by many things. Modeling helps us connect the dots so we can see how things are linked together. Models help predict conditions and events. They provide science-based information to help people make better decisions about our ocean and coasts. So although they may not be featured in your favorite fashion magazine, they are still stunning in their own right.
We’re joined today by Dr. Tracy Fanara, NOS Coastal Modeling Portfolio Manager. She manages the portfolio for offices within NOS along with the entire suite of NOS modeling efforts. She works closely with the Integrated Ocean Observing System or IOOS, the Center for Operational Oceanographic Products and Services or CO-OPS, Office of Coast Survey or OCS, and the National Geodetic Survey or NGS.
We had so much to talk about, that we decided to break up our discussion into two podcasts. In this episode, Tracy explains why coastal models are important, how they work, and how dust from the Saharan desert can contribute to harmful algal blooms in the Gulf of Mexico. In part two of our podcast, we dive deeper into how modeling helps NOAA carry out its mission and discuss specific case studies and benefits to the public.
So let’s jump right in!
To start off, I asked Tracy, why models? Why are they important? She shared with me a story when she worked with the Marine Laboratory in Florida as an expert and research scientist.

Dr. Tracy Fanara, NOS Coastal Modeling Portfolio Manager
Tracy Fanara: My research program had been historically funded by Florida “red tide.” Florida “red tide” is a common name for the species Karenia brevis which is a harmful algae species that persists in the Gulf of Mexico. You get a bloom every year and these blooms start offshore at the ocean bottom and come up to the surface with upwelling, move onshore, cause mass wildlife fatalities. The toxin can actually aerosolize meaning that it attaches onto sea salt particles in the air, moves on shore with winds and causes people to cough and sneeze. But for those with asthma or COPD or other respiratory illnesses, this can be really serious. So I got there and I was like, how have we been studying this organism, this one organism for some years and we still don’t have questions on how these blooms really start and no good predictive tools like how, you know, when they are going to end? We couldn’t answer those questions. And I started to get into it. First of all, I was humbled by the dynamics of our coastal ecosystem. And I realized that this is a huge ocean with a microscopic organism that acts completely different in the natural environment than it does in a laboratory which makes it tough to answer questions though lab scale tests. But as I went on as a modeler myself, now in this biological research environment, I didn’t understand why people weren’t using models and especially because we started to find out that the initiation of these blooms can be influenced by Saharan dust coming over from Africa into the Gulf of Mexico providing micronutrients that Karenia brevis, the organism responsible for “red tide” needs to feed. And they can possibly be influenced by upwelling from hurricane events coming into the Gulf of Mexico. Some scientists think that they might be getting nutrients from 40% of the United States that’s draining into the Gulf of Mexico. High nutrients causing the second largest hypoxic area in the world. And more recently, just a couple months ago, my friends found out that blue holes might be transporting nutrients from land out 50 miles off the coast of Florida and feeding these blooms to participate in that initiation phase.
HOST: Blue holes are underwater sinkholes, similar to sinkholes on land.
Tracy Fanara: So what I started to realize is that we cannot answer local questions through local research, everything in this world is connected. So really, we have to look at Florida “red tide”, this toxic algae species in the Gulf of Mexico from an Earth scale. And that’s where modeling comes in. You know, scientists had been taking spot samples for 70 years, analyzing those samples, finding out where we have cells, where we don’t and trying to connect the dots through statistics and that’s great, but it doesn’t give the full picture that modeling can. And having a model that interacts with all of these other models, that takes into account those hurricanes, that Saharan dust, everything like that. That’s the way that we are really going to predict these Florida “red tide” blooms and than on top of that, understanding the phytoplankton ecology in the Gulf of Mexico and changing regime patterns and changing chemistry. All of that is modeling. And that’s really where our big questions are answered is through our modeling efforts.
HOST: How do models work when it comes to connecting the dots?
Tracy Fanara: It's kinda like playing a video game. You know you’re trying to pass a board, by making everything work and if your numbers line up with what you find in the real world, then you won your level. But the modeling itself is really exciting and although no model is perfect this is the only way that we understand how everything in the world works. There’s only so much water in the world. We’re not creating any new water but the amount of water that was here today was here a thousand years ago, will be here a thousand years from now. So we’re constantly recycling this water and the movement of that water throughout our planet is what makes life on this planet possible. And I think it's important to understand that modeling shows those Earth systems. It's just absolutely amazing that the fact that Greenland is full of ice and Iceland is very nice and that's because of ocean currents and the gulf stream bringing warm waters from the Gulf of Mexico all the way up to Iceland and England, keeping them at the temperatures that they know of, the quality of life that they have. All of these Earth systems that work together, it's all understood by modeling. And space gives us a lot of that information which is also really cool. At NOS, we just transitioned a model to operations called WCOFS, the West Coast Operational Forecast System and this model is the first National Ocean Service model to use data assimilation. What that means is that it's using real-time information gathered from satellites, or buoys or gliders and it’s bringing it into the models, so that we have the most accurate models possible. I think that a lot of people don’t realize that NOAA has more satellites up in space than NASA does and the reason for that is that it’s impossible to solve local problems locally, we have to look at it from a big picture, from an Earth perspective. And that’s what modeling does.
HOST: What kind of information is provided to the public through modeling?
Tracy Fanara: You know, as I was just saying about Florida “red tide”, as far as harmful algae blooms, that’s really important, not only for economies because, you know, during these toxic algae blooms, people don’t want to travel to certain places so figuring out where those blooms are, so that we can alert the public to what places are actually safe, tourism boards, hotels, community/local governments, and the public all use different models to get those answers throughout our coasts. Also hypoxia, which is areas with really low oxygen, for fisheries, shellfish farmers. Navigation tools are used for captains, for any kind of boat that’s coming into dock. There’s a lot here. We have fishery models that are important to fisherman and commercial fishermen, captains, recreational tourism. There’s so much information that we provide different entities that provide that to the public or that we provide it directly to the public. So really, the sky is the limit on that, because everybody has a different reason to visit our coasts and a different concern when thinking about our coastlines and about our ocean, and about our water.
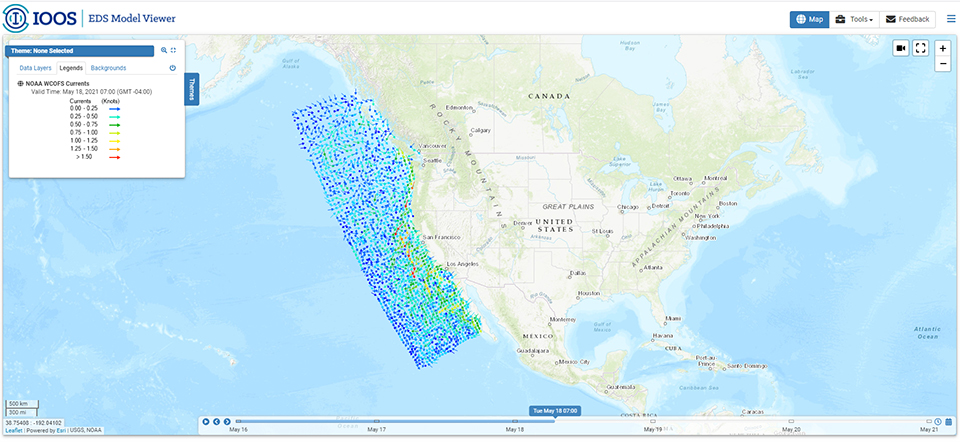
A screenshot of the West Coast Operational Forecast System (WCOFS) Currents taken from the IOOS Model Viewer.
HOST: Could you give some examples of models that are currently in use by NOAA?
Tracy Fanara: We have something called an EDS model viewer where the public can see all of the models that we have in operations and there are many. WCOFS is the one that was just recently released, the West Coast Operational Forecast System on the West Coast. We also have the Gulf of Mexico model that is being transitioned to operations currently and our model up in the north east is just awesome. Like how many different models nest within it, how it takes into account different geographic areas, with grid sizes, it's really cool. But I think that the one that the public uses the most is the storm surge model. It's called ADCIRC and it's out of the Office of Coast Survey, OCS, and it's the model that the National Weather Service uses to understand storm surge because it is the most accurate model out there. And it's pretty amazing to see you know, last year, when we had a hurricane come through the Gulf of Mexico and hit Louisania and it was spot on. I do a lot of science communications so I was using ADCIRC and our visualization tools that are open to the public to communicate what was happening with the hurricane as it was coming through. It was really neat to be able to do. I was only at my position for a couple weeks at that point and that was my first introduction to saying “hey, I work at NOAA, look at this cool stuff that we have and look at all this information that you can use to actually protect yourself during this time.” We had the Hurricane Eta come near Tampa Bay and I went down there and I made a video using that same ADCIRC model to see what the storm surge was going to be and I got to tell all my friends which ones might have a problem with flooding and which ones didn’t.
HOST: Tracy had said that there is a lot of collaboration and engagement with the stakeholders to ensure that their needs are being met in regards to the management of these models. I asked her to talk about this collaboration with the communities and stakeholders. She references PIs, which are principal investigators.
Tracy Fanara: We just can’t do it alone. There’s 11 regions throughout the U.S. that IOOS is connected with. And these regions have really good connections with the academic communities, with local governments, with the public and stakeholders in those areas. So we can’t be everywhere at once, and we need eyes on the ground, we need boots on the ground, we need fins in the water, everything like that to really understand what the public needs and how best to serve them. And the great thing about having those connections is that the PIs from the academic institutions, they are giving the information to the public in areas that we may not have an operational model yet, and that's why the COMT - the Coastal and Ocean Modeling and Testbed is so great, because it allows these PIs to bring those models that they have into operations through a grant process. And so that's what we’re looking to do right now, is figure out what the most critical areas and needs that our community has proposed to us so that we can decide which models to bring into operations within three years.
HOST: Are there any opportunities for the general public to get involved in to help with the modeling efforts?
Tracy Fanara: Oh, absolutely, there’s a number of different community science projects. One of them through NCCOS, I was actually on the development team at Marine Laboratories called HABSCOPE. And HABSCOPE is a cell phone microscope that community members are trained on to take samples, put a sample underneath the microscope, upload a 30 second video into an app that has an algorithm that automatically calculates the concentration of Florida “red tide”/toxic algae species and than that information automatically goes to a NOAA respiratory irritation model so that people in the Gulf coast have real time information on respiratory irritation forecasts so they know what beaches to go to basically on a regular basis.
HOST: Tracy had shared that this is a three to five day forecast that is provided to the public through NCCOS and the IOOS Gulf of Mexico Coastal Ocean Observing System Regional Association.
HOST: From a high-level view, could you touch on the current state of modeling?
Tracy Fanara: Yeah, the current state of modeling is evolving, constantly. So we are constantly coming up with new technology and the need for data assimilation or real-time information that is automatically put into a model so that we have the most accurate models possible. For me, understanding how all of these interactions throughout our coast all connect is really important and we’re far from having a consistent and continuous model throughout our coasts. Right now we have the coasts covered from whether its NOS operations or our regional associations or our PIs or academic community, you know, we have plenty of models, but to have them all talk to each other, to have them all on the same plane so that we understand how the entire system is running and working so that we can better predict changes is essential in my mind, in really taking these models that we have been collecting data on a regular time scale, and making predictions for long-term, for climate is going to be the future as well. But I think that with changing and innovating technologies using space, the sky’s really the limit with where we’re going. And so right now, the current state of modeling, is evolution. We are really just growing at a rapid pace right now and it's pretty amazing to be a part of it.
HOST: Tracy and I will continue our conversation on modeling in part two of this episode. We’ll talk more specifically about how modeling supports NOAA’s mission and the benefits it provides to the public. You don’t want to miss it!
Be sure to check out our show notes to learn more about modeling. This is the NOAA Ocean Podcast. Thanks for listening and be sure to subscribe to us in your podcast player of choice so you can catch all our episodes.
Transcript: Part Two
HOST: This is the NOAA Ocean Podcast. I’m Marissa Anderson. This is the second half of a two-part episode. If you missed the first one, check out our show notes or look for it in your podcast player of choice. It’s called “Connecting The Dots Through Modeling Part One.”
We’re joined today by Dr. Tracy Fanara, NOAA’s National Ocean Service Coastal Modeling Portfolio Manager. She manages the portfolio for offices within NOS along with the entire suite of NOS modeling efforts. In our last episode we talked about how modeling connects the dots and allows us to see the bigger picture of our world. We also discussed how local governments, decision makers, coastal community members, regional associations, and those who use navigation and ports benefit through the information provided by these coastal models. In part two of our episode, we dive deeper into how modeling helps NOAA carry out its mission and discuss specific case studies and benefits to those who are impacted.
I’d like to start by exploring how modeling supports some other NOAA mission areas. Let’s start out by talking about how modeling supports coastal resilience and reduces risks for coastal communities.
Tracy Fanara: So all of our models are really focused on supporting coastal resilience and reducing risk. Getting information to the public, to stakeholders so that they can make the best decisions and best practices to protect the public. So models can support coastal resilience and reduce risk because we have been doing this for so long. Now we have trends of changes on our coastlines. We can make predictions and forecasts from our real-time models, from our physical models. And then on top of that, with our base accurate physical models and adding these ecologic models on to it, these chemical models, we can answer more questions. So understanding that rising ocean that serves those, and then all those ecological aspects that we just talked about like, pathogens, algae blooms, hypoxia, things like that. It all supports coastal communities making decisions to protect lives and livelihoods.
HOST: So I would assume that models support the management of marine and coastal ecosystems in a similar fashion by providing valuable data to those who depend on it.
Tracy Fanara: Models can support management of marine and coastal ecosystems by providing information to stakeholders to decision makers so that they can relay information to the public, they can decide where to build, where not to build. They can decide where to put water, water pipelines, they can decide what the capacity of their waste water system needs to be. They can tell their fisheries what their productivity might be. What the surge might be, what the flooding might be, so these models absolutely support the management of these coastal and marine ecosystems as well as reduce risk for coastal communities.
HOST: Can models aid in emergency response efforts, such as a chemical spill?
Tracy Fanara: Oh absolutely, OR&R, is an NOS office that is really focused on chemical spills. NOS plays a huge role in figuring out the movement of a chemical spill, where it’s going to be, what it’s going to impact. So these models can tell the public or tell stakeholders, management, decision makers, exactly what threats their coastline is going to face and what geographic locations are going to be impacted. And so when we have a spill, these models can tell us how that foam is going to move in the water, where it’s going to reach and who it’s going to reach and impact.
HOST: What are considered to be the biggest threats to coastal communities and how do coastal models help to mitigate those threats?
Tracy Fanara: That’s a great question and depending on who you ask, they’ll will probably give you a different answer because we have so many things that are changing - ocean acidification, sea level rise, salt water encroachment onto drinking water systems, coral bleaching, changing ecology, changing ocean currents, changing migration patterns of animals like algae blooms, hypoxia. It just depends who you ask and where they are as to what their concern is. That’s where one of the things that my personal goal is focused on is getting people to realize that all these systems are connected so caring about the wildfires in the west when you’re on the Gulf of Mexico or the shellfish farmers in New England. It’s all connected and it’s all eventually going to impact you. I think that people in Michigan were pretty surprised when they saw the smoke from the wildfires in the west coming over, they had no clue why it was so dark outside. And I think that was a big eye opener right there for people in that area. And as far as our coastal oceans go, everybody impacts each other. 40% of the United States is draining into the Mississippi Atchafalaya watershed. Seventy percent of the nutrients that’s coming to this area is from agriculture. That increase in nutrients is causing algae blooms and hypoxia or areas of low oxygen that are lethal to the benthic ecology, any sessile or stagnant organisms and also because of how big it is, it can threaten fish or any kind of animal swimming through as well. How do we get that hypoxic event completely crumbles that economy for shellfish farmers, for fishermen in that area that rely on that for their living, for food, for money. How do we get that farmer in Iowa to care about that shellfish farmer in the Gulf of Mexico? And I think that through this whole process of understanding users needs and bringing those needs to the forefront so that everybody in the United States and the world can see what people are facing and when, so they understand how they might impact someone else and how someone else might impact them and how all of these systems are connected, can really be world changing. But to answer your question, the biggest threats as humans, we always care about the biggest threats to us. So it’s hard to answer that because depending on where you are and who you are, you’re going to answer that question differently.
HOST: So can models provide forecasts and tell where harmful algal blooms take place?
Tracy Fanara: Well, the physical models act as a kind of a base or a consistent data stream for which the harmful algae models can build upon and those models can be predictive, depending on which model it is. It can be real-time or it can take into account predictive tools that can forecast 3-5 days or long term forecasts. For instance, the Great Lakes for example, the harmful algae blooms that occur there, the cyanobacteria blooms. There are forecasting models in place. Now doing something like a forecasting model with Florida “red tide” is a lot more difficult long term because there is so many questions that we still have about that particular species and about the phytoplankton community, chemistry initiation in the Gulf of Mexico, where we haven’t had those ecological, chemical, biological models in addition to the physical models to really understand those interactions in a lake like Lake Okeechobee or our Great Lakes it’s more contained and we know a lot more about cyanobacteria initiation, determination than we do about Florida “red tide.” So I would say, short answer, yes, our coastal models enable predictions and forecasts for harmful algae blooms.
HOST: You had mentioned the model WCOFS or the West Coast Operational Forecast System in the last episode. Could you talk a little bit more about that?
Tracy Fanara: So what makes WCOFS so awesome is that not only does it use that data-assimilation for accurate physical modeling, but it also has a product called “Eco-Coast” which gives fisheries habitat information. It is going to be connected to something called “C-HARM” which is a California harmful algae bloom mapping model so that people on the coastlines can understand where harmful algae blooms are, where they’re going to occur, when they are going to terminate. And then it also has an ocean acidification and hypoxia aspect so that fisheries, decision makers can understand where there are going to have areas of low oxygen, and where ocean acidification is impacting coral reefs and bivalves, anything that is using calcium carbonate in their processes. So this model does everything from physics to fish and it’s the one that I like to talk about most because it does so much and answers so many questions for coastal communities.
HOST: We had talked about how user and stakeholder needs and requirements are constantly changing and evolving. Where do you see the future of modeling going? How will NOS adapt to that?
Tracy Fanara: The stakeholder needs are constantly changing and I see NOS adapting to it through their use of IOOS and through the open minds of OCS, NGS and CO-OPS. IOOS being the organization that’s going to work with regional associations, academic communities to really increase the breadth of our impacts, of our capabilities. And bring it into NOS operations. As far as the future and in meeting these stakeholder needs, I really see space being a big part of this, you know getting information from satellite data and from in situ sensors within the ocean, AVs, gliders, things like that. So in situ in this case would mean, sensors or other devices that are gathering data within the ocean, in real time. I really see technology playing a real big role in getting information in real time, reliable data that can be assimilated or entered right into a model so that we can have real time information in a changing world. It’s gonna be tough as far as predictions go because usually predictions are based on history, right? Well in a changing world, it’s tough to predict based on history and especially with all of these new technologies, it’s going to be tough. It’s exciting to be a part of this new era of technology and understanding of how our world works. But it’s also going to be very challenging to figure out where our efforts need to be. First how to prioritize and how we’re going to make everything come together at the end.
HOST: I asked Tracy what she would like our listeners to come away with from listening to both of these podcast episodes.
Tracy Fanara: The one thing that I want everybody to take away from this is that everything in this world is connected and that we are trying to understand what those connections are. But until then, understand that your actions every single day impact someone else. And modeling is the way that we’re going to make all those connections through all those data points and try best to protect our communities, our ecosystems, public health on our coastlines and inland, now and in the future.
HOST: If you want to learn more about modeling, check out our show notes. This is the NOAA Ocean Podcast. Thanks for listening. Catch all of our episodes by subscribing to us in your podcast player of choice.

From corals to coastal science, connect with ocean experts to explore questions about the ocean environment.
More Information
Social