A Laser is Worth a Thousand Words
NOAA Ocean Podcast: Episode 45
Lidar stands for light detection and ranging. We explore how this popular remote sensing method supports NOAA’s mission and enables scientists and mapping professionals to examine both natural and manmade environments with accuracy, precision, and flexibility.
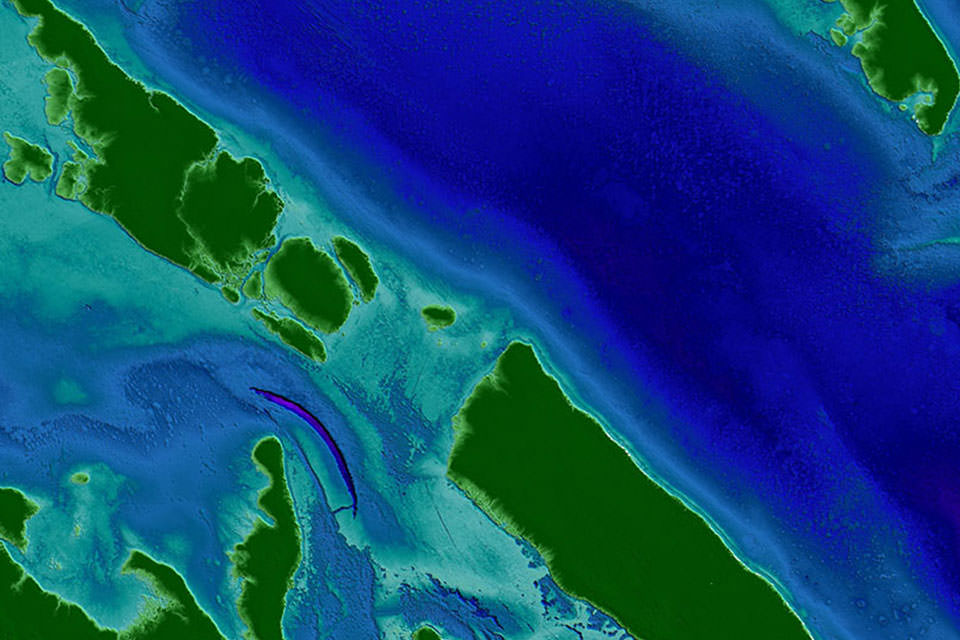
A digital elevation model of the Florida Keys area from a topobathy lidar system. Green represents higher elevations and dark blue/purple represents lower elevations.
Transcript
HOST: This is the NOAA Ocean Podcast. I’m Marissa Anderson.
You may have heard the saying, “a picture is worth a thousand words.” I would have to say that this absolutely applies to lidar as well, which is the subject of this podcast. Lidar stands for light detection and ranging. This technology has been around since the 1960s, but it became a popular remote sensing method when GPS came on the scene in the 1980s. Lidar systems allow scientists and mapping professionals to examine both natural and manmade environments with accuracy, precision, and flexibility.
There are two types of lidar - topographic and bathymetric. Topographic lidar typically uses a near-infrared laser to map the land, while bathymetric lidar uses water-penetrating green light to also measure seafloor and riverbed elevations.
Lidar datasets increase the accuracy of mapping for shorelines, inundation, and wetland habitat delineation and can also produce stunning imagery.
We are joined by Maryellen Sault, a cartographer from NOAA’s National Geodetic Survey or NGS for short, a program office within the National Ocean Service. Maryellen, thank you so much for joining us today!
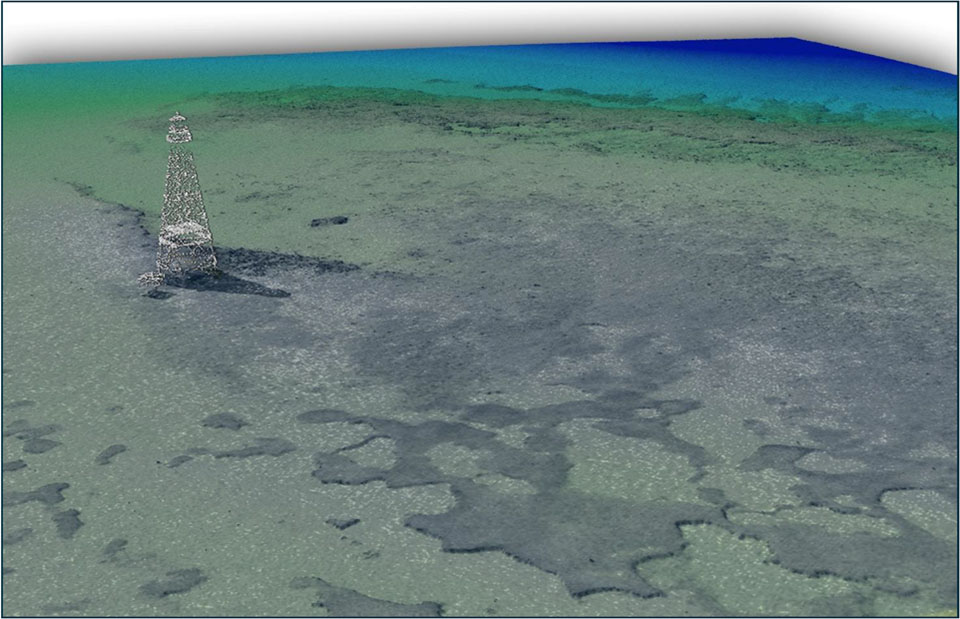
A lidar point cloud of a lighthouse in the Florida Keys area.
MARYELLEN SAULT: Thank you for having me!
HOST: So before we dive in, Maryellen, could you please tell us a little bit about your role within NGS and what you do on a daily basis?
MARYELLEN SAULT: Sure. I am a cartographer in the remote sensing division of NGS. Essentially, I work with shoreline data that supports the creation and maintenance of NOAA’s nautical charts.
HOST: What exactly does a cartographer do in NGS?
MARYELLEN SAULT: So we extract the shoreline from either aerial imagery, or from lidar, or from high resolution satellites. We provide that to the Office of Coast Survey so that they can use it to put on the nautical charts.
HOST: When you say, extract the shoreline, you’re referring to the process where cartographers draw a line at the interface between the land and the water. So for our discussion today, we’re going to focus on airborne lidar systems. These systems range in size and can be installed on airplanes, helicopters and drones. Maryellen, can you explain how a lidar system works?
MARYELLEN SAULT: An airborne lidar sensor consists of a couple of components. You have a laser, a scanner, a GPS and an Inertial Measurement Unit also known as an IMU. The sensor emits beams of light using the laser. It then computes distances to the ground based on how long it takes those beams of light to return to the sensor. We combine this information with the GPS and IMU data to determine the latitude, longitude and elevation for each of those points that are returned to the sensor. These points are often referred to as a lidar point cloud. When talking about lidar data, most folks may be familiar with digital elevation models which is really just a gridded interpretation of those points. You can think of them as a color-coded image where the colors represent elevation. There's also an intensity measurement associated with each point. These values represent the reflectivity of the object on the ground and can be used to create an image that looks very similar to a black and white photograph. This information can be very useful for interpretation.
HOST: You had mentioned IMU. Can you explain that a little bit more?
MARYELLEN SAULT: An IMU is a type of sensor that’s used to measure the rotation and acceleration of the aircraft. It’s combined with a GPS data to determine a highly precise position of the aircraft.
HOST: So what are the advantages of using lidar?
MARYELLEN SAULT: There are a few advantages that come to mind. One, we can acquire lidar at any time of the day because it’s an active remote sensing system. This means that it provides its own source of energy. Two, lidar is extremely accurate. And three, lidar sensors produce point clouds that are very dense and this allows us to create very detailed three dimensional surfaces.
HOST: Why is lidar so useful for NOAA?
MARYELLEN SAULT: Lidar is an extremely valuable dataset because it can be used to support a number of NOAA missions. For example:
- The Office of Coast Survey has started using lidar for recon when planning and conducting survey operations. Bathymetric lidar helps OCS fill in nearshore gaps that have historically been difficult for NOAA’s ships to survey.
- The Office for Coastal Management also uses lidar in their land cover mapping program called the Coastal Change Analysis Program. Lidar datasets are used in the wetland mapping aspect of that program and is also used to help with classifying vegetation based on elevation. OCM also uses lidar data in their Sea Level Rise and Coastal Flooding Impact Viewers.
- The National Centers for Coastal Ocean Science have also used lidar in some of their benthic habitat mapping and coastal change projects. So as you can see one lidar dataset can actually be used for multiple applications within NOAA.
HOST: How does NGS use this information to support their mission?
MARYELLEN SAULT: NGS maps the mean high-water line as well as the mean lower low water line. These shorelines support NOAA’s suite of nautical charts as I had mentioned. NGS uses a topobathy lidar system to collect wide swaths of elevation data on both land and in shallow water areas. The lidar points are processed and transformed to a tidal datum at which point a tidally referenced shoreline can be contoured.
HOST: That’s really interesting. Could you talk a little bit also how lidar helps us plan for climate change?
MARYELLEN SAULT: Since Lidar is so accurate and point clouds so dense, we can use this data to create really detailed digital elevation models. These models can be used to identify low lying areas that are prone to flooding or vulnerable beach front areas. Some cities are using this information to increase their resilience to climate change. And this is just one example of how lidar can help us plan for a changing climate.
HOST: I know we touched on some of the ways that NOAA and NGS use lidar. What are some of the more mainstream uses for this technology?
MARYELLEN SAULT: Lidar is used in a number of applications. From predicting drainage and crop yields, precision agricultural farming to creating flood maps to mapping ancient civilizations. The list goes on and on and we could be here all day talking about the applications that use lidar. But I’d like to touch on a few emerging uses of the lidar technology that you might be surprised to hear about. Lidar is being used in the automotive industry. Some vehicles are using it in their adaptive cruise control systems. Lidar sensors are now even being found in smartphones to make augmented reality apps more authentic and to help improve the quality of photographs in low light situations.
HOST: How has the lidar technology advanced in recent years?
MARYELLEN SAULT: Lidar systems have gotten smaller, they’ve gotten lighter and they can process multiple laser returns.The vertical accuracies are also twice as better when we look at lidar data from twenty years ago.
HOST: Coastal lidar datasets can provide helpful information for people who are interested in building resilient communities, identifying flood prone areas, and measuring beach erosion. So where can people go to download these datasets?
MARYELLEN SAULT: People can go to NOAA’s Digital Coast Data Access Viewer. This is a one-stop shop for searching and downloading topographic and topobathy datasets in the coastal zone. You’ll find datasets going back as far as 1996 from multiple federal, state and local agencies. And if you want to find data that goes beyond the coastal zone, your first stop should be the U.S. Interagency Elevation Inventory.
HOST: Thanks for chatting with us today, Maryellen. Be sure to check out our show notes for links to NOAA’s Digital Coast Access Viewer, the U.S. Interagency Elevation Inventory, NGS and the National Ocean Service. This is the NOAA Ocean Podcast. Thanks for listening and don’t forget to subscribe to us in your favorite podcast player.

From corals to coastal science, connect with ocean experts to explore questions about the ocean environment.
Social