Current Surveys 101
NOAA Ocean Podcast: Episode 09
How studying ocean movement provides an important service for the economy.

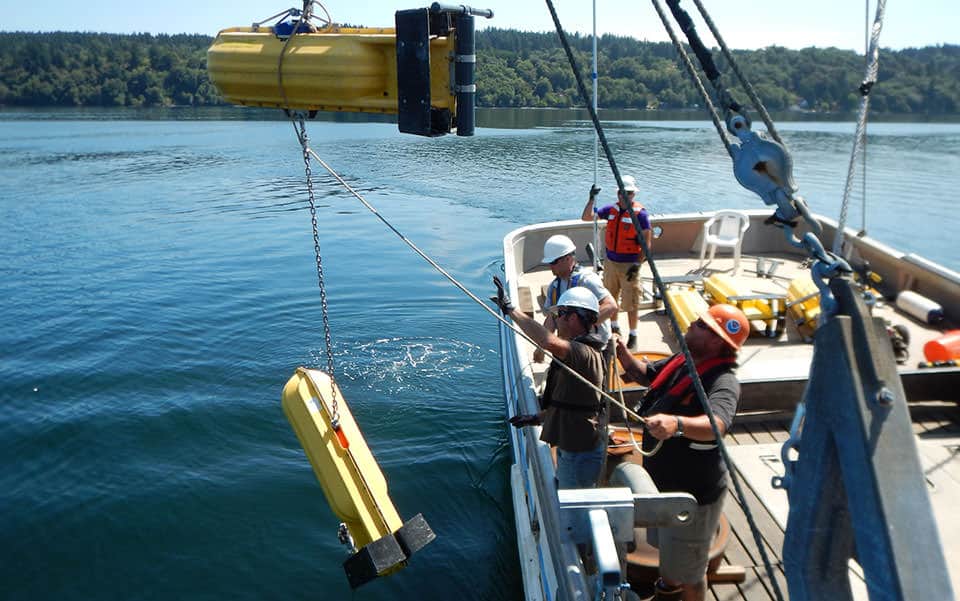
Current Meter Deployment
A NOAA team deploys a current meter with surface floats to take measurements throughout the water column during surveys of Puget Sound.
Transcript
HOST: You're listening to the NOAA Ocean Podcast from NOAA's National Ocean Service. I'm Megan Forbes. In this episode we're focusing on tides and currents…or more specifically current surveys. NOAA conducts current surveys in areas across the country to provide accurate tidal current predictions which many mariners depend on for safe navigation. Survey locations are selected based on user and navigation needs, oceanographic analysis and the time since the last survey.
To further understand this process, I sat down with Chris Paternostro, an oceanographer with the Center for Operational Oceanographic Products and Services at NOAA. Chris is an expert in coastal and estuarine circulation analysis and is the acting program manager of maritime services. Before we began discussing NOAA's role in current surveys, I wanted Chris to walk me through the differences between a tide, a current, and a tidal current. Here's what he had to say about what his work focuses on:
CHRIS PATERNOSTRO: I study the motion of the ocean (laughs). So the tides are the vertical movement of the water along the coast. You can witness this on beaches and on piers that stick out into the ocean. The tide is the actual water level movement – up and down, two to four times a day, and the movement is caused by the gravitational attraction to the sun and the moon. We can measure the water level movement towards the sun and the moon and from that we can understand the different frequencies that cause that motion. These are known as the tides. To obtain tides, you have to have a horizontal movement of the water, which is the currents, to move the water to those points to experience the mass lift of the water in the vertical direction.

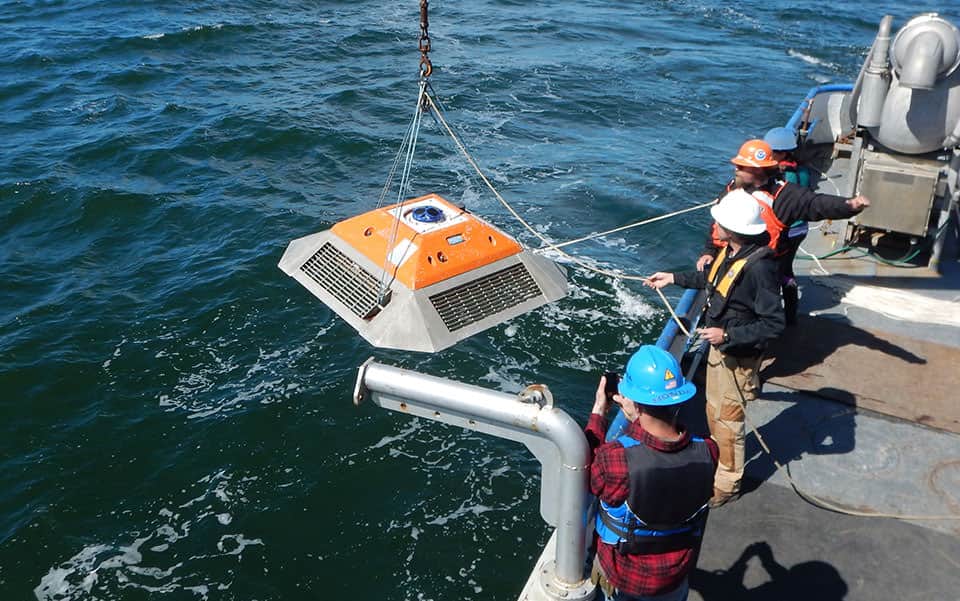
Measuring Bottom Currents
A NOAA team deploys a current meter to survey along the bottom of Puget Sound.
What is known as tidal currents is caused by the same gravitational force of the pull to the moon and the sun- but it's the horizontal advection of the water to allow for the tidal vertical lift in that area. There are other currents that we can measure too – freshwater runoff that goes into a river and gets deposited in a bay and then output into the sea, then there's also wind blowing across the water that causes currents, and there's a few other types of currents that are a little bit harder to measure and not as much of an influence along the coasts.
HOST: Next we talked about the many benefits of current surveys and what they provide for the public.
CHRIS PATERNOSTRO: The tidal current surveys that we produce at NOAA are a basin-wide survey of the flow of the water. I use the term "basin" to describe any body of water that is inland and surrounded by land. We usually deploy current meters for a month to four months long, and upwards of a year, so we can obtain data that we can bring back and do the analysis where we would understand the movement of the water with respect to the sun and the moon. It's beneficial primarily for safe navigation. The larger vessels that enter the U.S. coastal waters are required to carry the tide tables and the tidal current tables so that they are able to stay above the rocks, below the bridges, and in the middle of the channel. This is very useful to allow safe navigation up a long basin…like the Chesapeake Bay or through Puget Sound or San Francisco Bay…and it's also useful economically for [vessels] so they can time their journey. If they're in the middle of the Atlantic Ocean and their final destination is Baltimore, perhaps they would want to time it such that they enter the Chesapeake Bay at flood tide which will help them to use less gas to get up into the Chesapeake Bay, to go with the flow. There are some areas of the U.S. coast that have extremely strong tidal currents…and in this case, it may be dangerous to go with the flow. If a vessel is going with the flow it may lose maneuverability and steering capabilities and it just becomes something floating along the river below it. So for safety, they may choose to go at a different tide, which may cost more energy to travel – but it may keep them in the center of the channel.
It's also useful for search and rescue, and for contaminants fate and trajectory. The fate and trajectory refers to when oil or some other contaminant is spilled…NOAA has a duty to respond to oil spills…so when the fates of it is such that it is traveling toward the land or becoming a problem for a population of animals, we need to know how it's going to be moving on top of the water. The data, combined with a hydrodynamic model, is very useful to understanding where the water is going to go and we're able to forecast the movement and put counter-measures in front of it.
HOST: I asked Chris to tell me what it was like to be in the field conducting current surveys, and whether he liked that part of his job…
CHRIS PATERNOSTRO: The dream of every oceanographer is to go to sea or end up doing research on a tropical island. Most of what we do ends up working on a computer in Silver Spring, Maryland, calculating all of the data we've collected over the short time that we actually get to go into the field. Going out onto a vessel in the field is what brings me my energy…the majesty of the ocean brings me the joy and the thrill of what I do for a living. The past three years, we've been working in Puget Sound, to update the tidal current tables of data that was probably last collected in the 1940's. Back in 1940 they used to park a large vessel and anchor it off at three or four points, and send down a propeller that would send up acoustic clicks, and they would count the clicks for three days and try to get a determination of how fast the water was going over time. Nowadays…modern technology allows us to go out there and deploy these large instruments that sit on the bottom of the ocean and look up through the water column using sound – acoustic signals – it's able to collect a very high resolution understanding of how the water is moving throughout the entire water column.
To go out on one of these cruises is really quite amazing. We go out on a fishing vessel…there's probably five to eight of us…in close quarters such that we spend about a week or two weeks out on the ocean and we all become kind of good friends and probably worst enemies during these trips (laughs)…but everybody's energized by the ocean. The work we're doing is fascinating. Most of the time we're out on the deck putting together/attaching oceanographic equipment to a railroad wheel which acts as the anchor. Then we put a series of moorings together – chain and floats – and we put an Acoustic Doppler Current Profiler on top, which is our oceanographic instrument that looks up through the water column and sends sound to determine the flow of the water above it. Now, it's pretty easy to throw equipment into the water…it's rather difficult to get that equipment back. So all the field engineers and scientists spend a whole lot of time beforehand trying to configure this equipment such that it will release its anchor and then float to the surface. Sometimes things do not work so well and we spend hours if not days doing things like grappling for it – which is basically like sending down a big hook and try to wrap it around and yank it up to the surface.
The instrument itself, the Acoustic Doppler Current Profiler is this little circular white pill about two feet by three feet, and on top of it has three or four acoustic heads that it sends out the signal from and they're all tilted in a little bit different directions so we can measure three-dimensional flow of the water with these three or four heads. The data it collects is "the gold", this is the whole point of why we're going out there – inside this is a little data card and that is worth thousands and thousands of dollars, all the time and money we spend putting into this project. So we secure this current meter into this yellow torpedo-looking tube that has two large floats in it that help it float in the water column – and hopefully bring it to the surface when we ask for it to come.
HOST: Over the years in his career Chris has logged many hours of current survey and data analysis. I asked him to tell me about one of the more memorable experiences he's had at work.
CHRIS PATERNOSTRO: A train derailed over Mantua Creek carrying vinyl chloride, and started spilling its contents into the creek. This was an amazing cooperation between all parts of NOAA to quickly contain and remove this spill. My part of that was that I ran a team where we were able to put in one of these current meters into the creek. The creek is a small creek in New Jersey that connects the Delaware River to a large swamp that contains a whole lot of volume behind it, so the tidal flow in there was very strong. We had no predictions for this area, so we volunteered to put in a current meter and create predictions. So we sent a team up there with a current meter, and working with the team of emergency responders and with the emergency command, we were able to deploy a current meter right next to the bridge and start collecting data. Normally it takes twenty eight days to resolve the difference between the force of the moon and the sun, but they needed the data as soon as possible. So we left the current meter in for one day, pulled it out, took the data and then put it back down - and my team, filled with some really smart people, was able to start crunching the data and start coming out with tidal current predictions. We were delivering these predictions to the divers in real time, and so we were giving them predictions of when to be suited up and when to be diving during the slack water. The calculations we were coming out with were quite amazing with such a small amount of data and in the end they told us that our calculations helped remove the railroad that was crashed and helped to contain the flow…and save life and property, and save millions of dollars for conducting the restoration of that area.
HOST: This chat gave me new perspective on the critical nature of current surveys. The products we use every day, from our groceries to our favorite toys…a lot of that comes from vessels and ships. The current surveys and tidal predictions that NOAA provides make sure that these vessels arrive to port safely. Here's what Chris had to say about what that means to him.
CHRIS PATERNOSTRO: For me, as an oceanographer and as a citizen of the United States, I depend on the large number of goods that come in on oceanographic vessels. The work that I am doing helps provide safety in the knowledge of where the water will be moving in the future…and that's why current surveys are such an important service for the economy.
HOST: That's it for this episode of the NOAA Ocean Podcast. Thanks to Chris Paternostro for educating us on current surveys and how they help create accurate tidal predictions for navigational safety. To learn more about this project, or any ocean-related topic, visit our website at oceanservice.noaa.gov. We appreciate you taking the time to learn with us, and hope you'll join us again soon. Until then…thanks for listening.

From corals to coastal science, connect with ocean experts to explore questions about the ocean environment.
Subscribe to Feed | Subscribe in iTunes
Browse All Episodes of the NOAA Ocean podcast