NOAA Custom Chart Tool
NOAA Ocean Podcast: Episode 46
NOAA is moving into the digital age by phasing out paper nautical charts over five years. In this episode, we talk with NOAA Corps Capt. EJ Van Den Ameele, chief of Coast Survey's marine chart division, to learn how this transition will affect mariners and why electronic charts offer many advantages over paper. And if you still need paper charts, Coast Survey has you covered. EJ discusses how an online tool called NOAA Custom Chart makes it easy to export printable charts for all maritime areas.
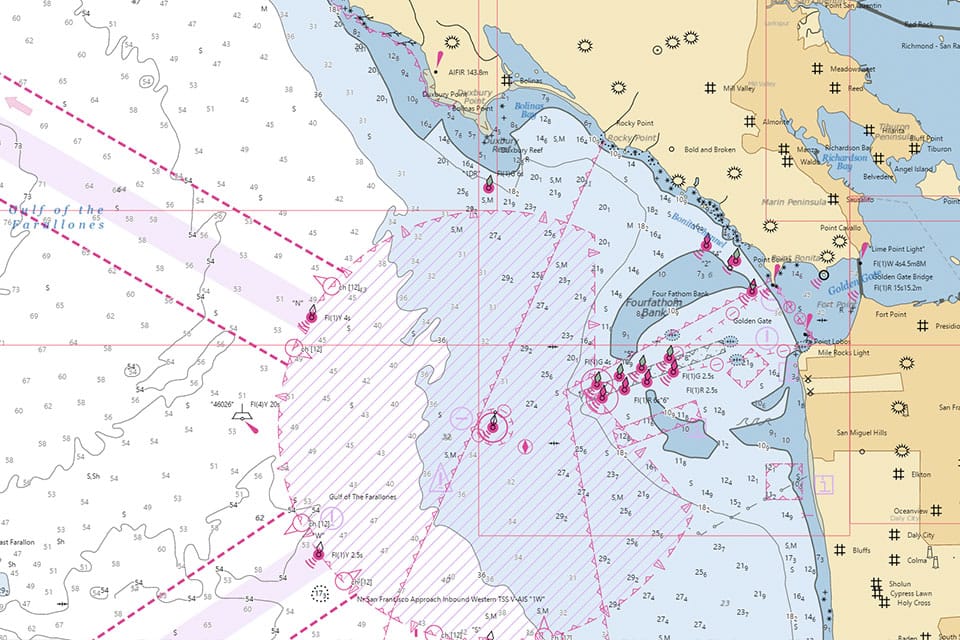
This is a view of a NOAA Custom Chart for the coast near San Francisco, California. With this free online tool, it's easy to zoom in and explore this region, or any area covered by NOAA's 3.2 million square nautical miles of charts. And once you find what you're looking for, it's just as easy to download a printable digital copy.
Transcript

NOAA Corps Captain EJ Van Den Ameele, Marine Chart Division Chief, Office of Coast Survey
HOST: This is the NOAA Ocean Podcast, I’m Troy Kitch. Now here’s something most people don’t know that blew my mind when I first learned about it. The nation’s very first science agency was the Survey of the Coast, the predecessor of NOAA’s Office of Coast Survey, which is now part of NOAA’s National Ocean Service. And it goes way, way back to February, 1807, when President Thomas Jefferson signed an Act to provide for surveying the coasts of the United States. That’s where our nation’s nautical charts began … and for hundreds of years, these charts were printed on paper.
But it’s the digital age, and change is afoot. Our guest today is here to talk about the transition from paper to electronic nautical charts — and, for those out there who still want paper charts, how you can go to the Coast Survey website and select and export just the areas of an electronic nautical chart that you need. It’s called NOAA Custom Chart. We’re joined by NOAA Corps Captain EJ Van Den Ameele. EJ is the chief of the Marine Chart Division in the Office of Coast Survey. EJ, thanks for joining us. So what exactly is a nautical chart? What’s it for?
EJ Van Den Ameele: So a nautical chart is, at its essence, a roadmap of the sea. It’s a map of the ocean that shows you all of the information you need for a vessel, a boat, or a ship to navigate safely. So it’s things like how deep the water is, where land and coastline is, where dangerous navigation are like shoal water, obstructions, or wrecks, or something that might harm a vessel. It shows where safe water is, and it shows what we call aids to navigation, things like buoys and lighthouses and lights. So it’s all the information contained in a map of the ocean that enables you to navigate safely.
HOST: And the nautical charts NOAA creates cover all of the nation’s coastal waterways?
EJ Van Den Ameele: All of our charts cover 3.2 million square nautical miles. All of the waters that are claimed by the United States, that are essentially owned by the U.S., so that’s most waters that go about 200 miles off the U.S. shoreline, including the Great Lakes, including some of the Mississippi River, and Alaska and Hawaii and the Pacific Islands. So, yes, the nautical charts we produce in NOAA cover all U.S. waters.
HOST: So I guess the transition from print charts to digital charts shouldn’t be that surprising in the 21st century, but it is a really big change.
EJ Van Den Ameele: Over time, for hundreds of years, people navigated in the ocean using paper nautical charts. The earliest known paper nautical charts go back to the 11th century. I think about growing up, the daily routine my parents would go through to get their news from reading a newspaper. After they got home from work and before dinner, they’d like to sit on the couch and read the news: the full large-format newspaper. But over time, by the time I grew up, they read all their news on the computer. They got it all online. So it’s very much similar with our transition to electronics: we’re presenting the same information, but instead of doing it on a large sheet of paper we’re doing it on a computer screen.
HOST: With electronic maps, as most of us know from map programs on our phones, a big benefit is that it’s kept more up-to-date because things change. How many changes are you routinely making to electronic nautical charts to keep them up-to-date?
EJ Van Den Ameele: Yeah, so that’s an interesting question. We get actually ten thousand pieces on average of new information that has to go on the charts every year that we have to update. So that could be things like a new survey of the sea floor because depths have changed. It could be a change because of a hurricane, or because of natural coastal processes. There could have been, say, a new marina that was built so we have to show that on the charts. We get ten thousand of those types of new information every year that we have to put on our charts, so that is our main job at the marine chart division at NOAA: is to analyze all of that information and have our cartographers make those changes to the electronic charts. And for any chart that has changed, we distribute new versions of those on a weekly basis, so that the mariners can have the most up-to-date information available so that they can navigate as safely as possible.
HOST: But I imagine that, you know, people have been using paper charts for so many hundreds of years, that many mariners might be apprehensive about paper charts going away. How are you addressing these concerns?
EJ Van Den Ameele: We do recognize that the desire to have a paper chart will probably never go away for a number of reasons. People still like to look at that large format. A lot of people might prefer to have a larger paper chart on their chart table on their sailboat, or maybe use it for planning or situational awareness purposes. The NOAA Custom Chart is a tool that allows you to take our electronic data, to allow people to specify exactly what they want to see on that piece of paper. So they can go in, they can specify the extents of the area they want to have appear on their chart, they can specify the scale, and then they can specify the paper size, and then they can download a PDF of that custom chart that they created, which they can then use to print out.
HOST: OK, let’s say I head over to the Coast Survey website to print out a chart from the NOAA Custom Chart tool. What am I going to see there?
EJ Van Den Ameele: You’ll see an overview of all of the U.S. waters to start with, it will be zoomed far out to see the entire United States. But then you can zoom in to your area of interest. So, one example: say you’re a sailor and your going out to sea this weekend to sail your boat in Narragansett Bay in Rhode Island. Now you can zoom in to Narragansett Bay and you can provide an outline of the area — you know, it can be all of Narragansett Bay or maybe a section of Narragansett Bay near Newport, Rhode Island, for example. You can go ahead and specify how big you want that to be, and what scale you would like it to appear at. And then the NOAA Custom Chart tool will then create a PDF of that area which you can download and have printed.
HOST: You said people can have customs charts printed - are there multiple options for printing?
EJ Van Den Ameele: There are other options. You can print it on your home printer, especially if you want a page size mini chart to use on your boat, for example, you can print that out on your printer at home. Another option is that you can take it to a local print shop and they may have a larger format printer that can print it out for you. We’re also in discussions with our Print-On-Demand vendors, or POD vendors. Those are currently where customers go to have the current suite of NOAA paper charts printed out, and we’re talking with them about how a model might work for the NOAA Custom Chart to be printed out.
HOST: I am aware that the Custom Chart tool launched in April 2021 as version 1.0, but before that you had a prototype version up on the site for many months. Have you included feedback from users to help you fine tune the tool?
EJ Van Den Ameele: Community feedback is absolutely critical for us to continually improve it. To make it look and feel more like a paper chart. We’ve also worked very closely with the maritime community as well as with our Print on Demand vendors, who give us critical feedback to make the tool as good as it can possibly be.
HOST: One thing I know about from looking at paper charts is that there’s the map part with the contoured lines and water depths and all that. But then there’s all of this other additional text also printed on the map. Do the electronic charts have all of these extra details, too?
EJ Van Den Ameele: Yes, so all this information, the supplementary information that we like to call notes still would be on the NOAA Custom Chart, but they will be presented in a slightly different manner. This is supplemental information that’s important for navigation within the area of the chart. They could be rules and regulations that you need to know about, or local information for that particular area that you might need to know about. On custom paper charts, those would be delivered on a separate page, whereas with the traditional paper charts those would be delivered within the boundary of the chart. So that’s one slight difference, but all the critical information will still be delivered to you with the NOAA custom chart.
HOST: So the goal is to give people something equivalent to the traditional paper nautical charts people are accustomed to — Is that what you’re aiming for?
EJ Van Den Ameele:I would say, in the end, we’re trying to deliver a product that ultimately will be better or at least as good as the current paper chart. And we think that giving the users the opportunity to choose the chart that they want to the exact dimensions and requirements that they have in mind for their particular use will ultimately provide an improved product. And I would also say, for any of your apprehensions or concerns, we would love to hear your feedback. So we encourage everybody to go on the NOAA custom chart site take it for a test drive let us know what you think, and give us some constructive feedback on how we can make it better.
HOST: And the transition away from paper charts is starting now, in 2021.
EJ Van Den Ameele: That is correct. We just announced the cancellation of our first chart. That is a chart for Lake Tahoe, 18665, and the Lake Tahoe chart represents the kickoff of our sunset of raster and paper charts. And so that will continue over the coming years, and we expect to have that process complete by January 2025.
HOST: A short sidebar here for the listener: you might wonder what EJ means by “raster charts.” Raster is a word that just means it’s a digital scanned copy of a print chart. What you see is what you get: if you try to zoom in, you’ll just see a closer view of the print chart and, at a certain point, it’ll look blurry. An electronic navigation chart, by contrast, is all-digital. So as you zoom in, more details show up on the chart. And because it’s digital — made up of what are called vector graphics — the image quality remains crisp and clear at any resolution. Now back to the interview.
So Lake Tahoe is the first chart to be cancelled, and all charts will be cancelled by 2025. I’m guessing here that you started with Lake Tahoe for a reason, probably because it’s one of the less critical nautical charts?
EJ Van Den Ameele: Yes, absolutely. You realize there are some charts that are absolutely critical both for commerce, for navigation, as well as for national defense and security. And those will be among the charts that will be cancelled towards the end of the process. But some of the charts that have low usage rates currently, or maybe charts that are getting more and more out of date will be the ones we will cancel sooner in the process.
HOST: This is really quite a huge undertaking, especially when you consider paper charts go back to the early 1800s in this country. What has it been like working on such an historic change?
EJ Van Den Ameele: You know, I’ve always liked advancements in technology, while certainly honoring the tradition of nautical charts, so I think it’s exciting because we’re trying to do both. We’re trying to honor the purpose of nautical charts, the tradition of nautical charts, but do it in a modernized way. It really enables users to have the most up to date information, as well as to better specify exactly what their needs are and what they want from the custom chart. So I think it’s exciting to see and try to meet both of those needs and requirements.
HOST: What’s the main thing you want people to take away from our talk today.
EJ Van Den Ameele: The NOAA Custom Chart tool is coming and we want it to be as good as it can possibly be and that requires feedback and input from everybody. So we’d love everyone to go to the site, take it for a test drive, give us your honest thoughts on how we can make it better in providing a product that’s good for navigation that will keep you as safe as you can possibly be out on the water.
HOST: Thanks to NOAA Corps Captain EJ Van Den Ameele for joining us for this episode. EJ is chief of the Marine Chart Division in the Office of Coast Survey. Subscribe to us wherever you get your podcasts. You can find our show notes and a transcript of this episode on our website at oceanservice.noaa.gov(http://oceanservice.noaa.gov). Look for the podcast tab, you can’t miss it. Thanks for listening to the NOAA Ocean Podcast.

From corals to coastal science, connect with ocean experts to explore questions about the ocean environment.
Social