Navigating the Sea is Safer, More Efficient With Digital Charts
NOAA Ocean Podcast: Episode 25
Like GPS devices for drivers, digital charts make traveling on the ocean easier for mariners.
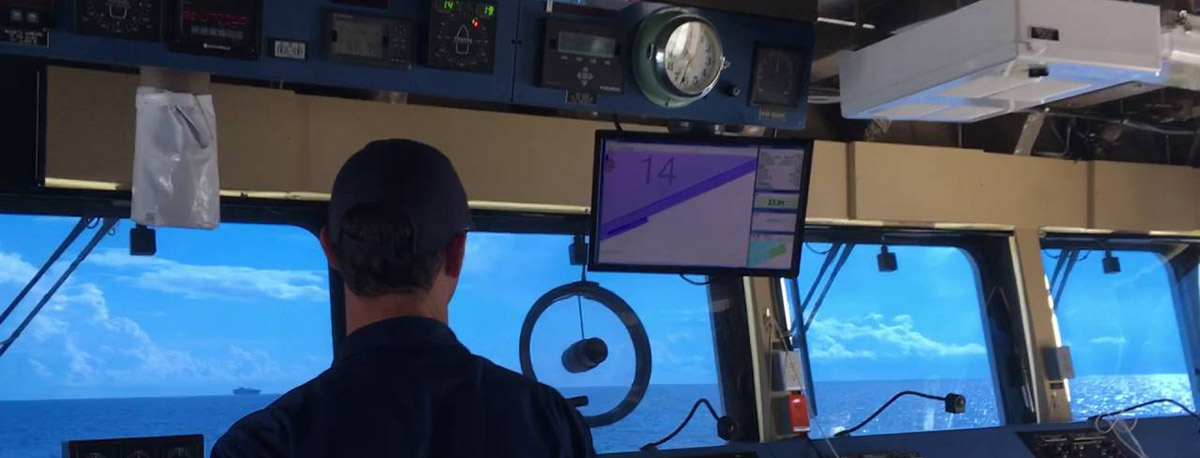
Navigating NOAA Ship Ferdinand R. Hassler. The ship conducts hydrographic surveys, meaning that it collects data about the shape of the seafloor. This data is used to make nautical charts.
Transcript
HOST: This is the NOAA Ocean Podcast. I’m Fran Webber.
Humans have long been both drawn to and repelled by the sea. For many, the sea means danger and mystery. It’s a place of storms and secrets hidden in deep, dark waters. But the ocean also holds many treasures: the delights of swimming and sailing, seafood, and other natural resources. To take to the sea can be the start of an adventure, and any adventurer needs a map, whether their adventure is on a cruise ship, fishing vessel, oil tanker or sailboat.
Like a map, a nautical chart helps travelers find their way. But instead of cities and roads, nautical charts show the shoreline, water depths, tides, and aids to navigation — like buoys — as well as objects that might be a hazard to travelers like rocks or shipwrecks.
Nautical charts for U.S. waters are made by cartographers at the Office of Coast Survey, an office within NOAA, and all ships of a certain size must have NOAA charts on board. I’ve got Allison Wittrock, a cartographer with the Office of Coast Survey, here today to tell us more about NOAA’s new digital charts.
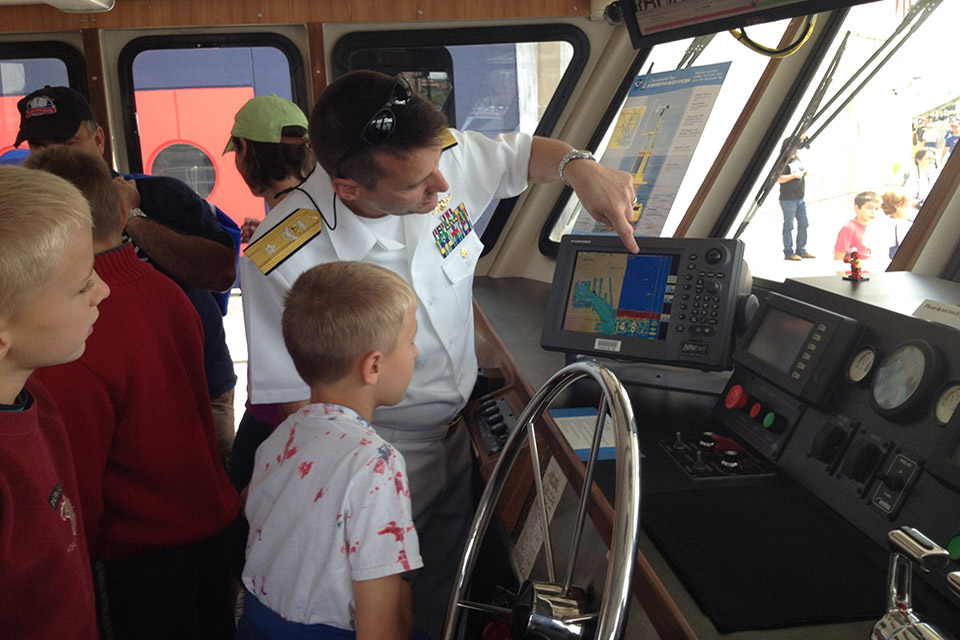
Rear Admiral Gerd Glang (retired) introduces kids to nautical charts onboard R/V Bay Hydro II. He is showing the visitors an electronic navigational chart on an ECDIS, or, electronic chart display information system.
HOST: Allison -- Thanks for being here today!
ALLISON WITTROCK: Thanks! Happy to be here!
HOST: So, to get started, why are nautical charts important?
ALLISON WITTROCK: Our nation’s ports are incredibly important to our economy. In 2017, foreign trades through U.S. ports were valued at $1.6 trillion dollars. All of those goods, all of those imports and exports, were moved from port to port via ship. And those ships move along our marine highways, which are depicted on our nautical charts. So, I would say the nautical chart is one of the most fundamental tools that’s available to a mariner.
HOST: So, can you tell me a little bit more about the history of paper charts and how digital charts are different?
ALLISON WITTROCK: Yeah, there are really three main phases of nautical charts. The very first charts were created in the late 13th century, and they were drawn with pen and ink on parchment. And then for many centuries after that, they were printed on paper, hence the term “paper chart.” The next phase of charting is the raster nautical chart or raster navigational chart, and we call that the RNC. It’s essentially a scanned or digitized paper chart where the points, lines, and areas are represented by rows and columns of colored pixels, and, unlike paper charts, the RNCs are digital, and they’re georeferenced. So, each one of those colored pixels is actually assigned a latitude and longitude. And then, since the 1990s, NOAA has produced the electronic navigational chart, or ENC.
HOST: So, how is an ENC better than a paper chart?
ALLISON WITTROCK: I think the biggest way the ENCs are better than a paper chart is that ENCs can be really easily updated by the mariner. Another way the ENCs are better is that they’re GPS-enabled. So, it’s very similar to using a paper road map versus your Google Maps on your phone. So, if you can remember, in the past, when you were going on a road trip, and you had this paper map, and you had to constantly know what highway you were on and pay attention to what intersection you just passed so you can figure out where you are on that paper map. And now, you can just pull up Google Maps on your phone, and the little blue dot tells you exactly where you are in relation to the map at any moment, and that’s exactly the way it is on a ship. The ENC shows your vessel’s position at any given time, so you know exactly where you are and where any hazards are in the water around you.
Another big reason that ENCs are better is safety. Now, large commercial vessels are required to use ENCs and an electronic chart display and information system, or an ECDIS for short. So, the ECDIS system is great because the mariners know the depth of their ships. So let’s say they’re drawing 10 meters. They can set an alarm system that any time their ship is headed towards an area that’s shallower than 10 meters, or if their ship is heading towards an underwater danger like a rock, obstruction, or a shipwreck, an audible alarm actually goes off on the ship’s bridge to let them know that they’re heading into a dangerous area. So, there’s many other reasons why I think the ENCs are better than the paper charts, but those are some of the big ones.
HOST: What really excites you about the future of charting?
ALLISON WITTROCK: I think the most exciting thing is all of the improvements that we have planned for our ENCs in the future. Specifically, we’re working on an ENC rescheming project. And what that’s going to entail is equal or better coverage of charts that we have now. So, it’ll be a larger scale in some areas, meaning that you’re actually going to see more details in certain ports.
We’re also moving towards a gridded format. Right now, if you look at our ENC suite, you see almost like a puzzle. And, there’s just not a lot of rhyme and reason. When we — when the Office of Coast Survey first started, our country was very young. And we were really just making charts as certain ports or certain geographic areas became more important to the country. So, we didn’t start out making our charts with some grand plan of our how our chart suite would look in the end. So, right now we have a lot of duplicate coverage in some areas. Our plan for the future is to have these ENC footprints that are in a standardized and consistent grid. So, each cell is going to meet up seamlessly with the ENC cell next to it. That will mean less duplicate work for the cartographers who are making the corrections on the chart. And it’s also then easier for the mariners because right now, if a mariner wants to go to New York they have — you know, one area could have a significant number of charts to choose from, and, you know, deciding the one that is best for their transit can sometimes be difficult. So, if you just have one seamless set of charts, it’s pretty easy to say “I’m going to New York Harbor, and I need the charts in this specific area.” So, that’s kind of exciting.
But I think the biggest thing, the biggest change in the future is that the U.S. is moving our nautical charts into the metric system. The U.S. is probably one of the very few countries that are actually compiling our charts in feet and fathoms. And, going back to my original point of how many imports and exports are going through our ports every year, that’s a lot of international ships and ship captains that are coming from countries that are used to using metric. So, that’s probably one of the biggest things, is that the U.S. is going to metric in the future.
HOST: So, Allison, if people want to find out more about charts, where can they go?
ALLISON WITTROCK: They can go to the website for the Office of Coast Survey. And there you can look at those historical charts that I mentioned. Or, you can actually, we have an ENC viewer, where you can just pan around. If you’ve wanted to see exactly what an ENC looks like, you can check it out on your own at the Office of Coast Survey website.
HOST: Sounds cool. Thanks so much for being here with us today, Allison.
ALLISON WITTROCK: Thank you.
HOST: To learn more about nautical charts, or any ocean-related subject, visit our website at oceanservice.noaa.gov, and subscribe to our podcast in your podcast player of choice. And please, leave us a review in iTunes. It will really help us reach more listeners.
 An official website of the United States government.
Social