Tides and Water Levels
How are Tides Measured? - The Old System
Since the early 1800s, NOAA and its predecessor organizations have been measuring, describing and predicting tides along the coasts of the United States. The longest continuous sea level records exists for the Presidio, in San Francisco, California. Records for the area date back to June 30, 1854. Today, the Center for Operational Oceanographic Products and Services (CO-OPS), which is part of NOAA’s National Ocean Service (NOS), is responsible for recording and disseminating water level data.
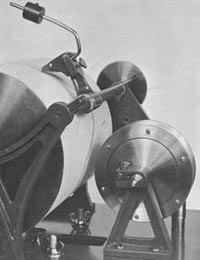
In the past, most water level measuring systems used a recorder driven by a float in a “stilling” well. A stilling well calms the waters around the water level sensor. A typical stilling well consisted of a 12-inch wide pipe. Inside the stilling well, an 8-inch diameter float was hung by wire from the recording unit above.
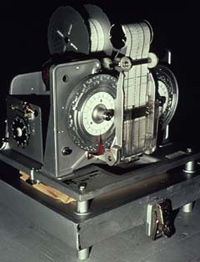
Before computers were used, water level data was recorded on a continuously running pen and ink strip chart. These records were collected by observers once a month and mailed to headquarters for manual processing. In the 1960s, data were recorded onto mechanically punched paper tape that were read into a computer for processing. Water levels were recorded at 6-minute intervals. Observers maintained and adjusted the clocks, and calibrated the gauges with the tide readings. Tide stations were visited annually to maintain the tide houses and clean biological fouling from the underwater surfaces. During these annual visits, the components and support structures also were checked for stability.
Although these systems worked well, they had their limitations. Stations were subject to recording errors and marine fouling, and were constantly in need of maintenance. In addition, the measurement and data processing equipment could not provide users with information until weeks after the data was collected.
Special tide houses were constructed to shelter permanent water level recorders, protecting them from harsh environmental conditions. In this diagram, we can see how the analog data recorder (ADR) is situated inside the house with the float, and the stilling well located directly beneath it. Attached to one of the piers pilings is a tidal staff. Essentially a giant measuring stick, this device would allow scientists to manually observe the tidal level and then compare it to the readings taken by the analog recorder.