Make a sounding box and discover the profile of a model seafloor
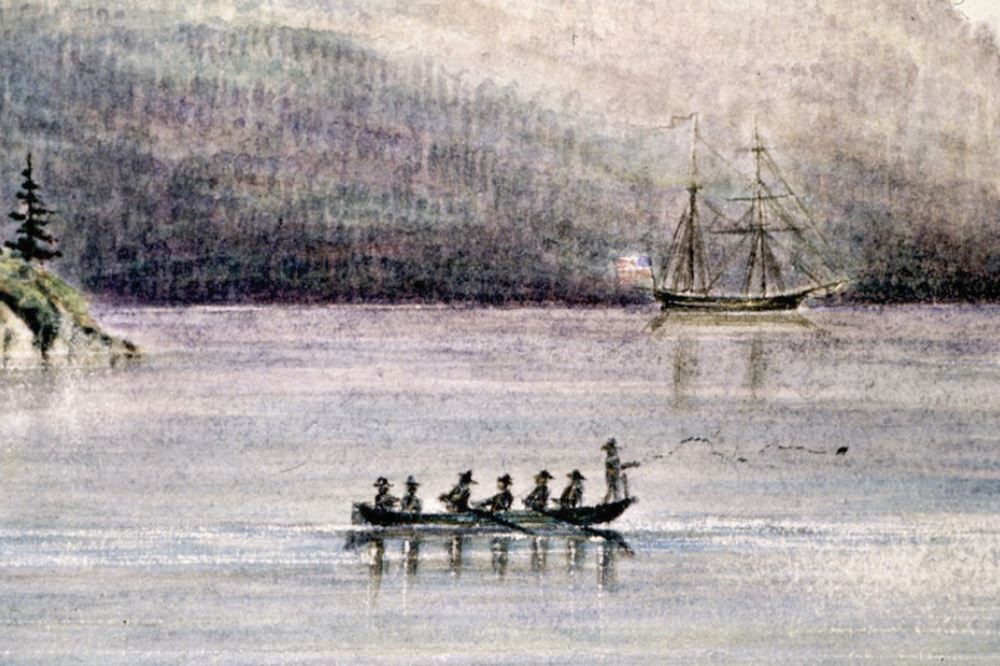
Sounding party off USCS Brig FAUNTLEROY. 1857-Earliest picture of Coast Survey sounding operations. Watercolor by James Madison Alden, nephew of Lieutenant Commanding James Alden.
“At about 9 p.m., I felt the vessel graze the bottom... I grabbed my cap, and rushed up the steps leading to the spar deck... and immediately afterward heard the most dreadful and agonizing sounds as the ship hurled herself on the reef... the call of the boatswain: ‘All hands prepare to abandon ship,’ I heard above all of this din. I could hardly walk the decks; the pounding and jumping of the ship swaying me from side to side."
- Capt. R. O. Crisp on the loss of the revenue cutter Tahoma after hitting an uncharted reef on the south side of the Aleutian Islands, Alaska on September 20, 1914
If Alaska had been a U.S. state in 1914, the reef that wrecked the Tahoma might have been on Captain Crisp’s navigation charts. This is because more than a hundred years earlier, in 1807, President Thomas Jefferson established the Survey of the Coast to chart the U.S. coastline to make the coasts of our nation safe for navigation. A top priority of the Coast Survey was (and is) to create charts that show the shape of the coasts, currents, and the depth of coastal waters. Gathering information needed for these charts is called “hydrography,” and people who do this work are known as “hydrographers” (“hydro” means water, and “grapher” is one who writes).
Today, hydrographers working for NOAA’s Office of Coast Survey continue the work begun by the Survey of the Coast. These scientific nomads travel around the coasts collecting information needed for up-to-date charts that guide ships in and out of U.S. ports. The most basic job of hydrographers is taking measurements of water depth (called “soundings”).
Modern hydrographers use sidescan and multibeam sonar and satellite-based global positioning systems (GPS) to produce very detailed pictures of the sea floor. For many years though, hydrographers used lead lines to make depth measurements. A lead line is a rope or line with a 10-pound lead weight attached to the end. The hydrographer lowers the line into the water until the weight reaches the bottom. Markings on the line show how much line has been let out, which is equal to the depth of the water. Depth soundings made with lead lines are accurate, but they take a lot of time and only give information about single points of the sea bottom—so many lead line measurements are needed to accurately survey a given area.
Here’s a way to get a feel for hydrographic surveying with a lead line—and you don’t even have to get your feet wet!
What You Will Need
This activity is most challenging if you have one or more friends who also make a sounding box and set up a model seafloor inside the box. Then you can trade sounding boxes and compete to see who can discover everything on an unknown seafloor.
For each sounding box you will need:
A shoebox or other cardboard box that is about 2 inches to 4 inches high
A replaceable air conditioner filter large enough to cover the box
A wooden skewer about 4 inches longer than the height of the sounding box
A ruler
A felt tip marker
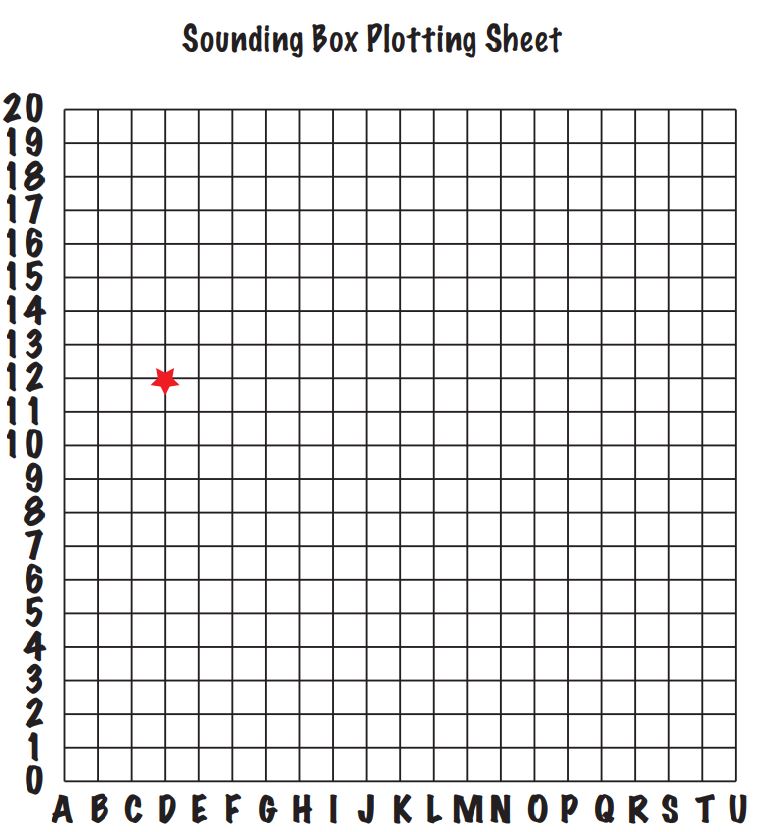
A copy of the “Sounding Box Plotting Sheet"
A pencil
Small objects such as Lego® blocks, toy vehicles, rocks, modeling clay, etc.
Masking tape
Rubber cement
How to Do It
Use masking tape or rubber cement to fasten small objects to the inside bottom of the cardboard box.
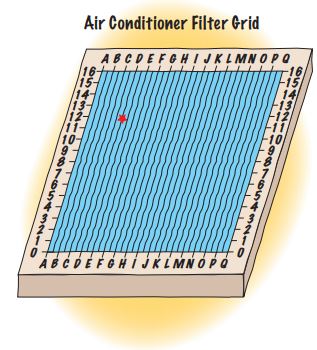
Mark the sides of the air conditioner filter at 1/2-inch intervals as shown in the “Air Conditioner Filter Grid” drawing. Label the horizontal lines with numbers, and vertical lines with letters as shown.
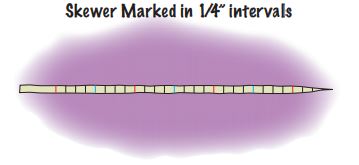
Mark your wooden skewer every 1/4-inch with a felt-tip marker. If you have colored markers, you can use a different color to mark one-inch and two-inch intervals as shown on the “Sounding Skewer Marking” diagram. This makes it easier to tell how deep the skewer is when you take “soundings.”
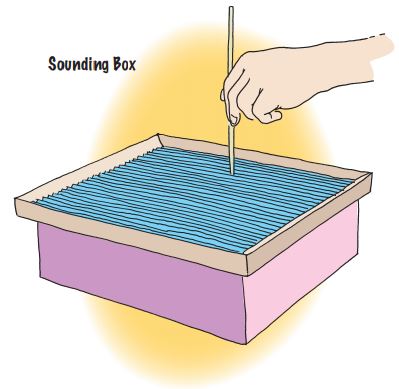
Fasten the air conditioner filter to the cardboard box with masking tape so no one can see inside the box.
Now it’s time to be a hydrographer! Use a ruler and the grid on the air conditioner filter to locate specific spots for “soundings.” Take “soundings” by gently pushing the skewer through the air conditioner filter until the skewer hits bottom. Read the “depth” on the skewer, and record this measurement in the place on the “Sounding Box Plotting Sheet” that matches the sampling location on the air conditioner filter grid. For example, the red star on the “Sounding Box Plotting Sheet” matches the location of the red star on the “Air Conditioner Filter Grid” drawing. If your sounding box is less than 10 inches x 10 inches, you won’t use all of the grid squares. If it is larger than 10 inches x 10 inches, add more horizontal and vertical lines to the Plotting Sheet.
Continue making soundings until you think you have a clear picture of the model seafloor. Outline the features of the model seafloor on the Plotting Sheet, then remove the filter from the top of the box and see how well your Plotting Sheet compares with the actual “seafloor.”
Want to do more?
Check out these books at the library:
The Coast Mappers by Taylor Morrison
Mapping the Seas by Walter Oleksy
Maps and Globes by Harriet Barton
The Story of Maps and Navigation (Signs of the Times) by Anita Ganeri
Small Worlds: Maps and Map Making by Karen Romano Young
 An official website of the United States government.