Perform a demonstation of a survey technique used by scientists to estimate fish populations.
Humans have relied on the ocean for longer than recorded history. Humans eat many species of marine fish, so we want to know the number of fish in parts of the ocean available for us to catch. This is a big reason why scientists are interested in estimating ocean populations.
Courtesy Alaska Fisheries Science Center, NOAA
The ocean covers 70% of the earth and contains many different habitats. Even in the open ocean, the difference in sunlight and temperature between the surface and 500 feet deep is enough to make different habitat for different species. Some animals like it warm and sunny at the surface, but others like it cold and dark where it is deeper.
How do scientists count ocean animals? Specific equipment and strategies have been developed to better estimate various populations. One of these is the Alaskan Walleye pollock, a close relative of the cod fish. This species is an important source of food (fish sticks, cat food, imitation crab meat among many other items) and is the center of a multi-million dollar fishery. One way scientists count pollock is by echolocation. They shoot sound waves through the water, and the waves bounce off the fishes’ swim bladders (sacks fi lled with air inside the fish). The acoustic image the scientists see can include other fish, so the only way to be sure how many pollock are in a specific area is to bring the fish up using a sample trawl net. Once the pollock are caught in the net, they are all counted, right? Well, not really. It is very difficult to count that many fish.
https://www.aliexpress.com
What researchers do instead is get a subsample, a smaller sample of the whole. First, they weigh the net of pollock, and then the fish are split into a few subsamples. Scientists find the average age and weight of the pollock in each subsample. Then they estimate the total biomass for the entire net of fish, the sample. For example, if one fish weighs 3 pounds, then there must be 10,000 fish in a 30,000 pound sample. Based on the main sample, the net full of fish, the grand total of fish in a school of pollock seen with echolocation can then be estimated.
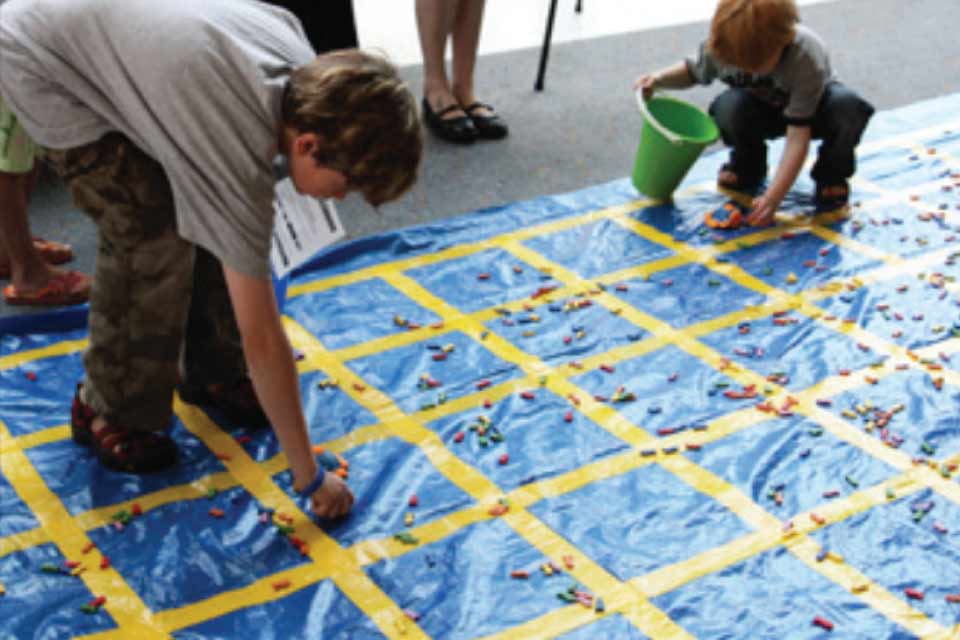
But how do scientists know where they counted fish and where they did not? They put an imaginary grid over the ocean floor in a certain area, and then count the fish in different squares of that grid; a method called surveying. You can do the same thing scientists do with your friends or your class with an activity called Fish Fetch.
What You Will Need
Blue tarp with a 10 x 10 grid of 1 square foot cells laid out with yellow duct tape
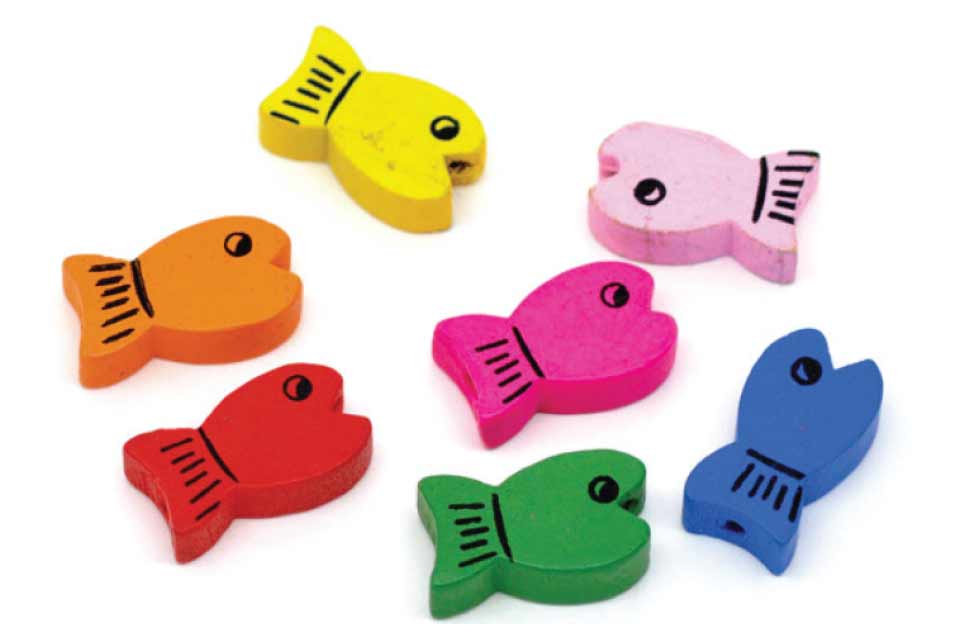
1000 Fish-shaped craft beads, approximately 1” in length and in assorted solid colors, (to represent the total fish population)
5 plastic sand pails, referred to as “scientifically calibrated sample buckets"
5 sample selectors (e.g. soft foam boat, preferably one that bounces erratically rather than rolling)
Whiteboard or flipchart to write on
Whisk broom (optional) to redistribute fish after sampling
How to Do It
Scatter the 1000 fish around on the grid.
Ask, “How many fish do you think are on the grid?” (This is an initial guess – some will take a wild guess, others will try to figure it out visually in a more systematic way).
Players next go “out into the ocean” and throw their squishy boat onto the grid. The square that the ship lands on is the random sample.
Players count all the fish in the blue part of the square and put the fish into their bucket.
Players record the number of fish in each sample on the whiteboard or flipchart. Counts of zero are valid observations.
Ask “How can you figure out, on average, how many fish were in the squares that you counted?” (Answer: add up the number of fish in the samples, and divide by the number of samples). Players can do the math themselves on the whiteboard, or an adult can do it for them.
Ask, “If this is the average number of fish per square, how can you figure out how many fish there are in all?” (Answer: count the number of squares in the grid—100—and multiply the average number by 100).
Compare the initial guess of how many fish there were to the estimate using the samples.
Throw the fish back into the “sea.” The whisk broom can be used to redistribute the fish around the grid. You can experiment with an even distribution of fish or a clumped distribution (where some squares have a lot of fish in them and others have none).
 An official website of the United States government.