#ScienceAtSea
Gallery: Sonar Operations
Using sonar, NOAA scientists are able to map huge areas of the seafloor in a relatively short amount of time. The NOAA Ship Nancy Foster has two multibeam sonars that send out three different frequencies of sound. Each frequency allows researchers to map seafloor topography at different depths. The ship sonars also detect "backscatter," which is a measure of the intensity of sound as it reflects off the ocean bottom. This tells researchers if the seafloor is relatively hard (e.g., corals or rocks) or soft (e.g., mud); and smooth or rough. Combining the topography and backscatter data allows scientists to create very detailed three-dimensional maps of the shape of the seaflloor and habitats present on the bottom of the ocean.
Animation and Photos:
This animation illustrates how sonar and video are used to create maps of coral reef habitats. In each image, the yellow line shows where a remotely operated vehicle (ROV) traveled to collect underwater video and photos of coral reefs and sandy areas. This ROV imagery is used to verify the types of seafloor habitats depicted in the sonar data. Image #1 shows sonar backscatter. Backscatter is the amount of sound returned from the seafloor and can tell researchers how hard or soft the seafloor is. Brighter areas are smoother and darker areas are rougher. This information is important when creating maps of coral reef habitats. Image #2 shows shows water depth. Shallower areas are lighter blue and deeper areas are darker blue. Image #3 shows how rough or bumpy the seafloor is. Pink areas are less bumpy and greener areas are bumpier. Image #4 shows how rough or bumpy the seafloor is, coupled with black lines that show the division between different habitat types. These lines are computed using backscatter, depth, and roughness information.
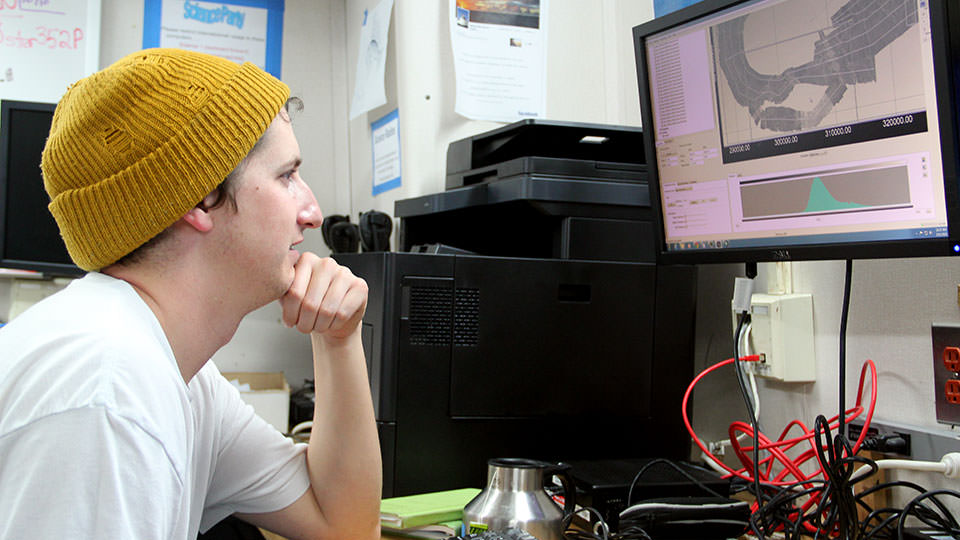
NOAA acoustic mapping specialist Will Sauter processes and interprets multibeam sonar backscatter. Backscatter is the amount of sound returned from the seafloor and can tell researchers how hard, soft, rough, or smooth the seafloor is.
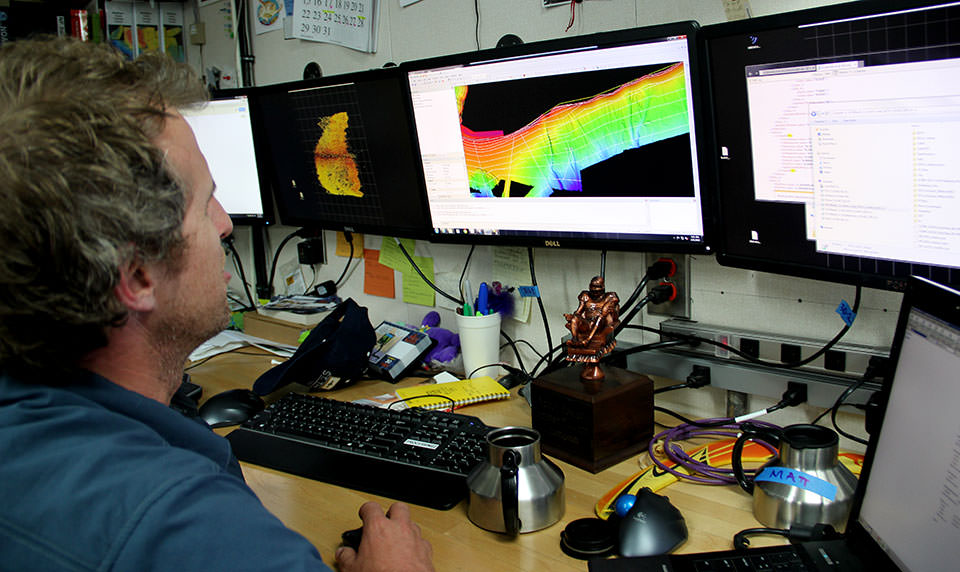
Hydrographer Mike Stecher converts sonar data into imagery. The data collected during the mapping cruise is also used to update NOAA nautical charts.
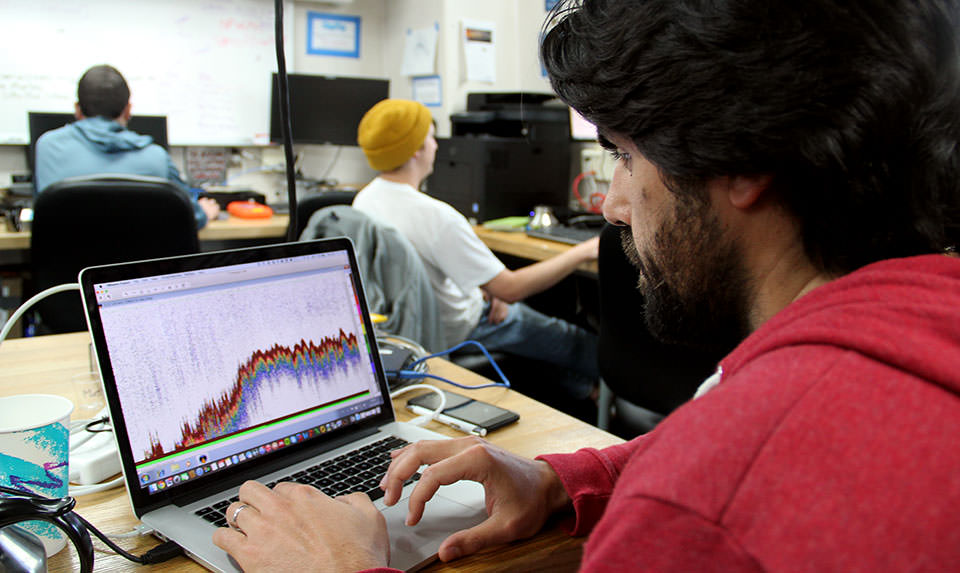
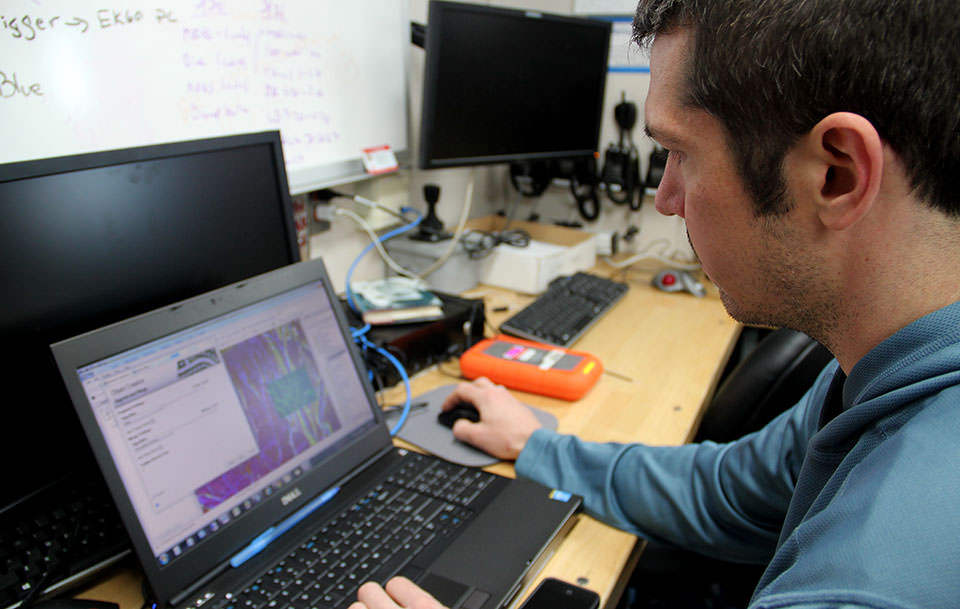
Fabio Campanella, a researcher at NOS's lab in Beaufort, North Carolina, examines fisheries sonar data. Campanella is working on methods to detect schools of fish and, potentially, identify species of fish using sound acoustics and statistical algorithms.
Bryan Costa, geospatial scientist, creates a draft habitat map using sonar data collected overnight. During the eight-day mission, researchers deploy a remotely operated vehicle during the daytime and collect sonar data overnight.
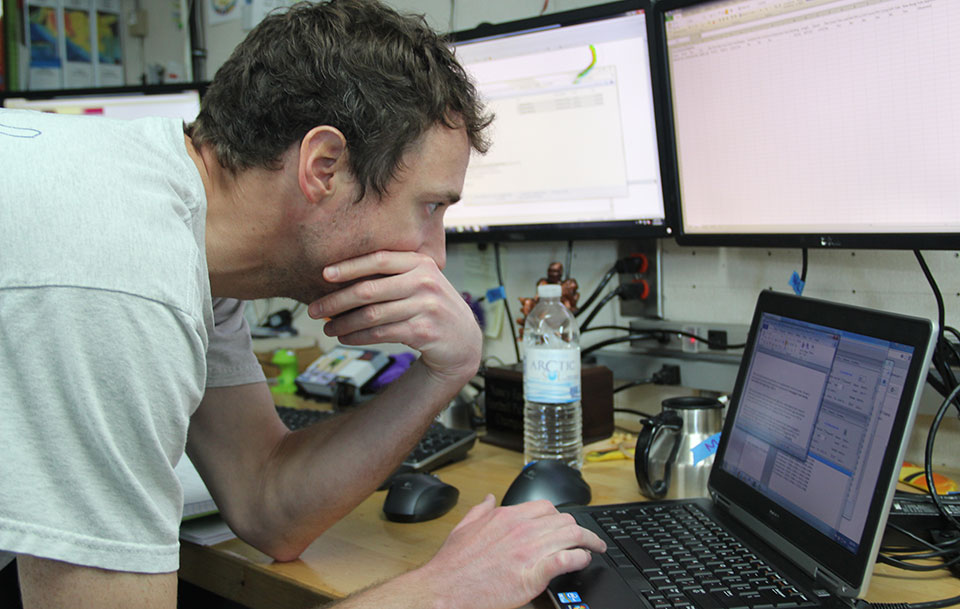
Matt Wilson, physical scientist at the NOAA Atlantic Hydrographic Branch in Norfolk, Virginia. Wilson is ensuring the incoming hydrographic data meets Coast Survey specifications with regards to data quality and integrity for updating nautical charts.