Highest Water Levels During Hurricane Hermine
At 6.1 feet, the highest measured water levels during this storm were at Cedar Key, Florida.
Highest Water Levels During Hermine
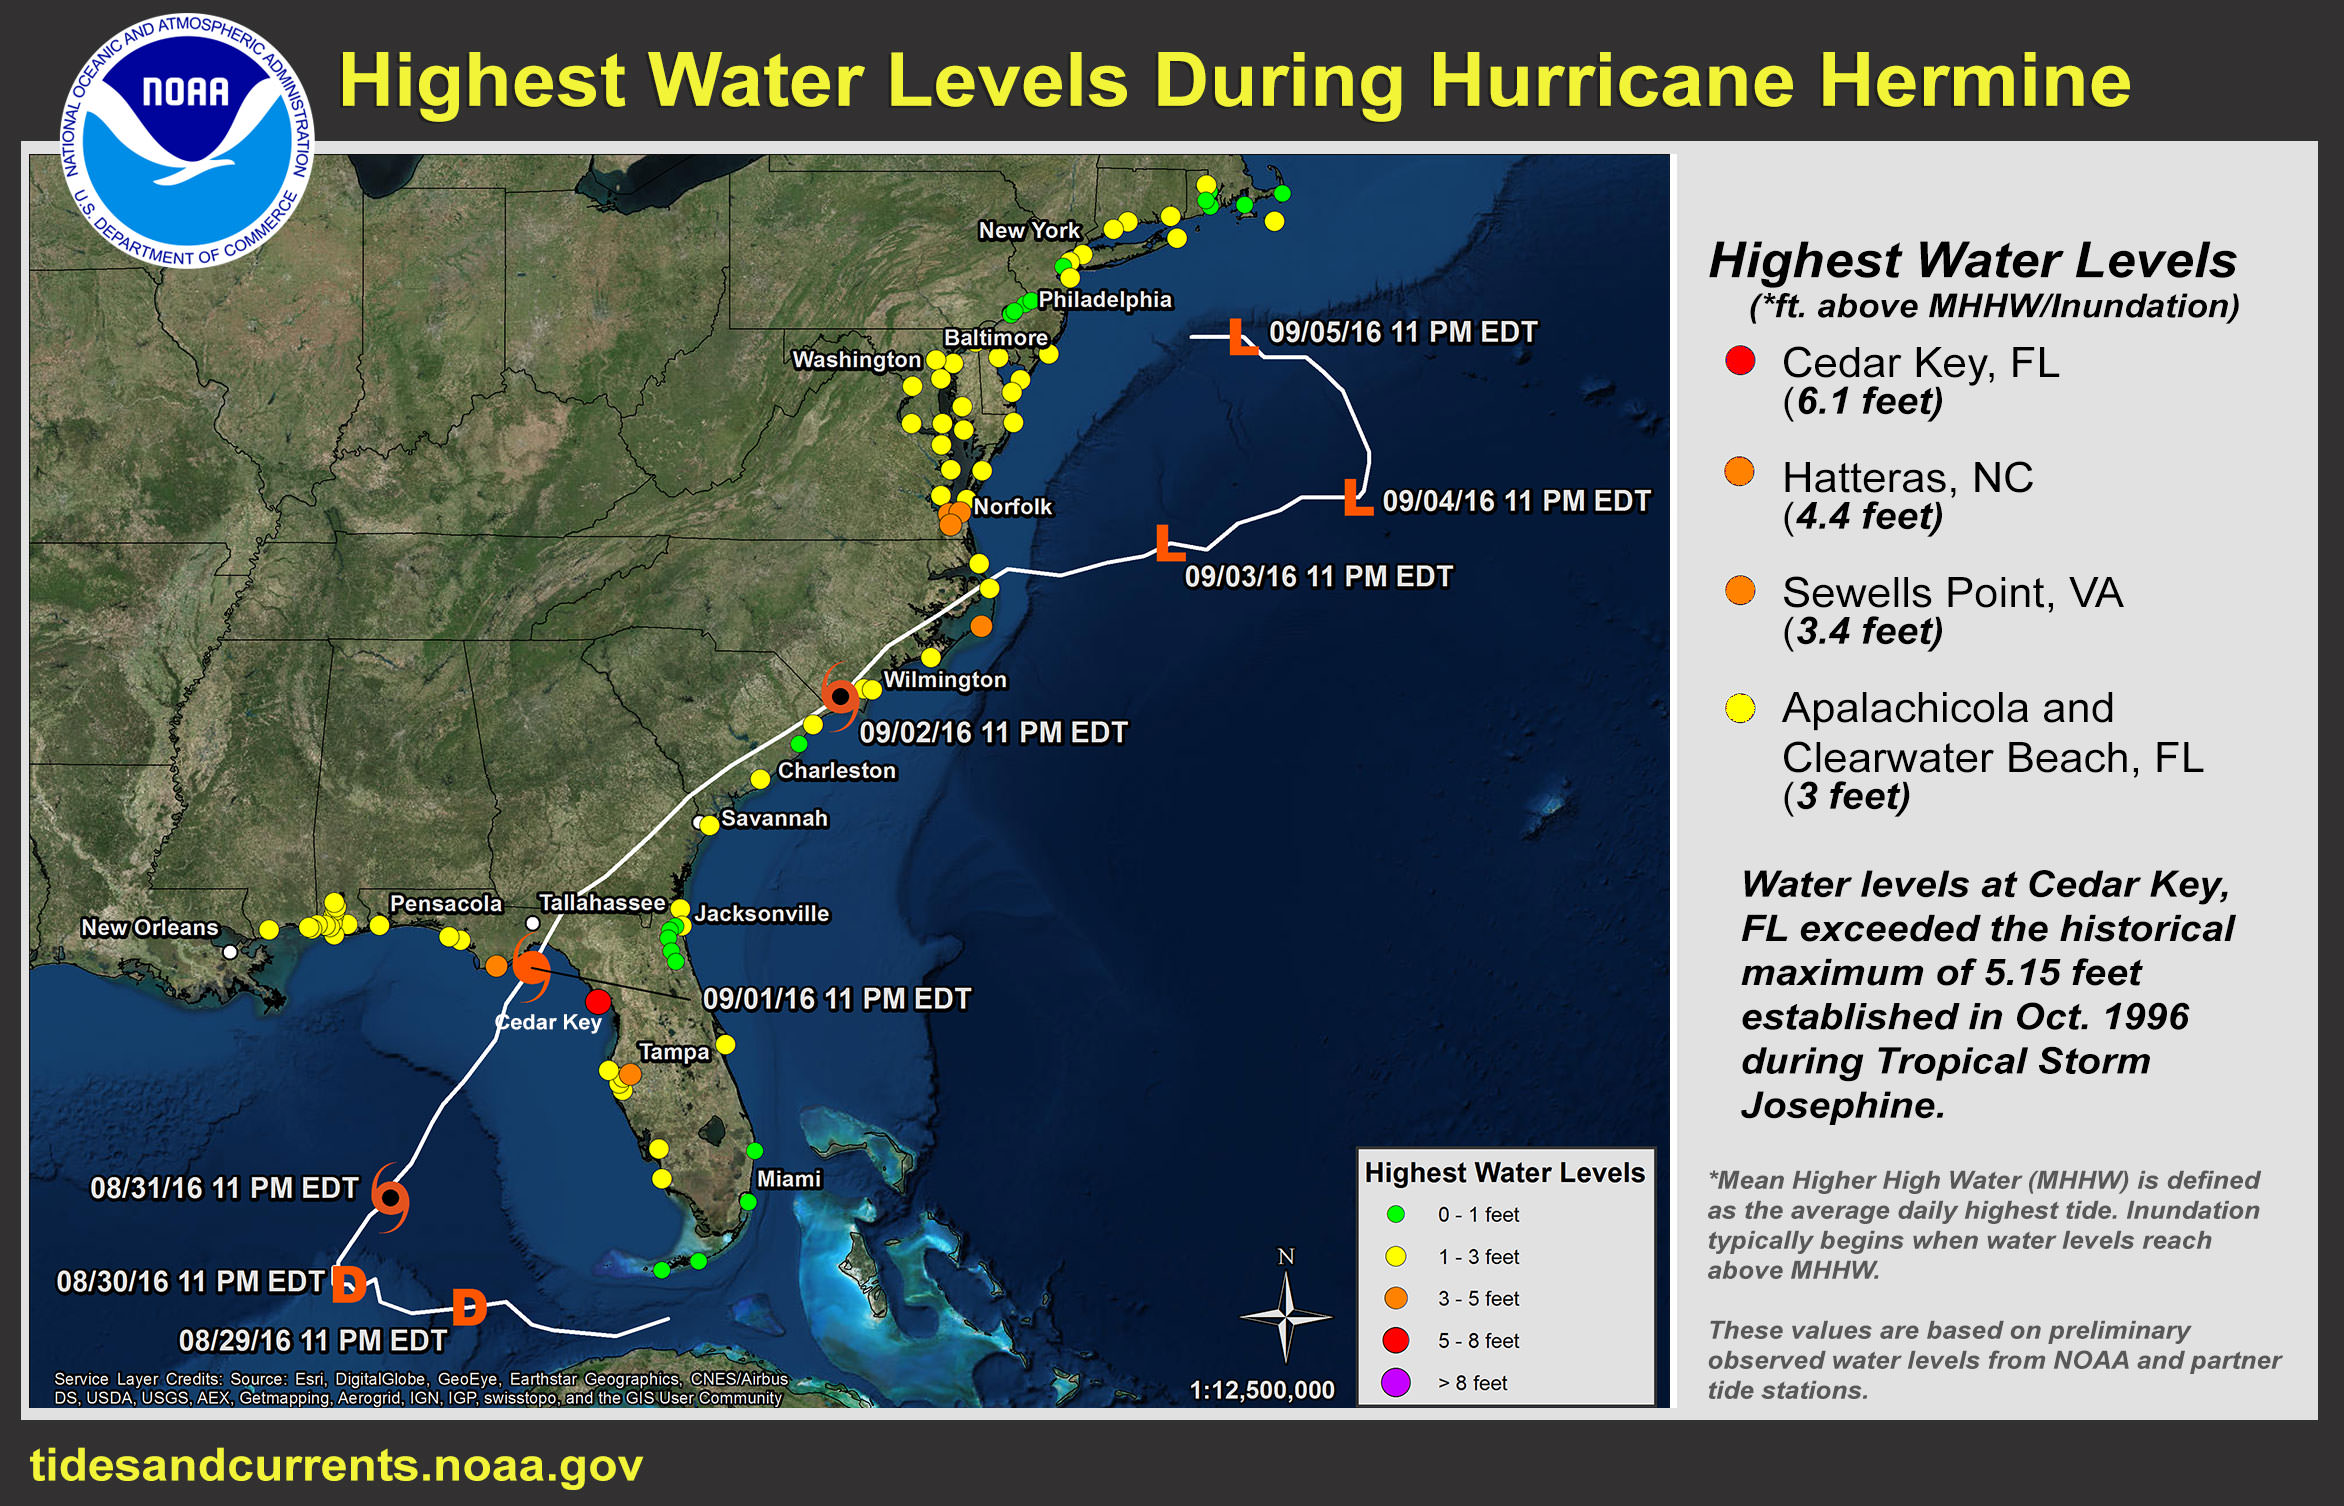
This graphic shows the highest water levels reached at stations impacted by Hermine from August 29 - September 5, 2016. Water levels at Cedar Key, Florida—the highest observed water levels during this storm— exceeded the historical maximum of 5.15 feet established in October 1996 during Tropical Storm Josephine. Download this infographic | Infographic Text
NOAA's Center for Operational Oceanographic Products and Services maintains a permanent observing system that includes 210 continuously operating water level stations throughout the U.S. and its territories. These water level stations provide real-time oceanographic and meteorological observations, which are critical data for communities, particularly during storms impacting the coast.
This graphic depicts highest water levels along the coast throughout the duration of this storm. Highest water levels are measured in feet above Mean Higher High Water (MHHW). MHHW is defined as the average daily highest tide. Inundation typically begins when water levels exceed MHHW.
The values depicted on this graphic and listed below are based on preliminary observed water levels from NOAA and partner tide stations.
| NOAA Tide Station Location (Listed North to South) |
Measured Water Level (feet) |
| Chatham, Massachusetts | 0.85 |
| Woods Hole, Massachusetts | 0.89 |
| Nantucket Island, Massachusetts | 1.12 |
| Newport, Rhode Island | 0.94 |
| Conimicut Light, Rhode Island | 0.82 |
| Providence, Rhode Island | 1.03 |
| Quonset Point, Rhode Island | 0.79 |
| New London, Connecticut | 1.13 |
| New Haven, Connecticut | 1.08 |
| Bridgeport, Connecticut | 1.21 |
| Montauk, New York | 1.54 |
| Kings Point, New York | 1.44 |
| The Battery, New York | 1.1 |
| Bergen Point West Reach, New York | 0.95 |
| Sandy Hook, New Jersey | 1.1 |
| Atlantic City, New Jersey | 1.8 |
| Cape May, New Jersey | 1.74 |
| Ship John Shoal, New Jersey | 1.23 |
| Burlington, Delaware River, New Jersey | 0.77 |
| Philadelphia, Pennsylvania | 0.94 |
| Newbold, Pennsylvania | 0.77 |
| Delaware City, Deleware | 0.99 |
| Reedy Point, Deleware | 1.09 |
| Lewes, Deleware | 1.7 |
| Ocean City Inlet, Maryland | 1.58 |
| Bishops Head, Maryland | 1.49 |
| Cambridge, Maryland | 1.42 |
| Tolchester Beach, Maryland | 1.24 |
| Chesapeake City, Maryland | 1.4 |
| Baltimore, Maryland | 1.31 |
| Annapolis, Maryland | 1.35 |
| Solomons Island, Maryland | 1.51 |
| Washington, DC | 1.59 |
| Wachapreague, Virginia | 2.83 |
| Kiptopeke, Virginia | 2.53 |
| Dahlgren, Virginia | 1.85 |
| Lewisetta, Virginia | 1.97 |
| Bridesburg, Pennsylvania | 0.76 |
| Windmill Point, Virginia | 2.37 |
| Yorktown USCG Training Center, Virginia | 2.85 |
| Sewells Point, Virginia | 3.4 |
| Chesapeake Bay Bridge Tunnel, Virginia | 3.23 |
| Money Point, Virginia | 3.45 |
| Duck, North Carolina | 2.68 |
| Oregon Inlet Marina, North Carolina | 2.32 |
| USCG Station Hatteras, North Carolina | 4.38 |
| Beaufort, North Carolina | 1.58 |
| Wilmington, North Carolina | 1.44 |
| Wrightsville Beach, North Carolina | 1.4 |
| Springmaid Pier, South Carolina | 1.14 |
| Oyster Landing (N Inlet Estuary), South Carolina | 0.98 |
| Charleston, South Carolina | 1.14 |
| Fort Pulaski, Georgia | 1.31 |
| Fernandina Beach, Florida | 1.15 |
| Mayport (Bar Pilots Dock), Florida | 1.08 |
| Dames Point, Florida | 0.84 |
| Southbank Riverwalk, St Johns River, Florida | 0.66 |
| I-295 Bridge, St Johns River, Florida | 0.78 |
| Red Bay Point, St Johns River, Florida | 0.71 |
| Racy Point, St Johns River, Florida | 0.86 |
| Trident Pier, Florida | 1.05 |
| Lake Worth Pier, Florida | 0.63 |
| Virginia Key, Florida | 0.78 |
| Vaca Key, Florida | 0.69 |
| Key West, Florida | 0.9 |
| Naples, Florida | 1.69 |
| Fort Myers, Florida | 2.06 |
| Port Manatee, Florida | 2.34 |
| St Petersburg, Tampa Bay, Florida | 2.64 |
| Old Port Tampa, Florida | 2.98 |
| Mckay Bay Entrance, Florida | 3.15 |
| Clearwater Beach, Florida | 3 |
| Cedar Key, Florida | 6.1 |
| Apalachicola, Florida | 3.04 |
| Panama City, Florida | 1.6 |
| Panama City Beach, Florida | 1.67 |
| Pensacola, Florida | 1.68 |
| Weeks Bay, Mobile Bay, Alabama | 1.33 |
| Dauphin Island, Alabama | 1.56 |
| Dog River Bridge, Alabama | 1.13 |
| East Fowl River Bridge, Alabama | 1.3 |
| Coast Guard Sector Mobile, Alabama | 1.33 |
| Mobile State Docks, Alabama | 1.11 |
| Chickasaw Creek, Alabama | 1.08 |
| West Fowl River Bridge, Alabama | 1.22 |
| Bayou La Batre Bridge, Alabama | 1.36 |
| Grand Bay NERR, Mississippi Sound, Mississippi | 1.35 |
| Dock E, Port of Pascagoula, Mississippi | 1.49 |
| Pascagoula NOAA Lab, Mississippi | 1.42 |
| Bay Waveland Yacht Club, Mississippi | 1.79 |
Infographic Text
Highest Water Levels (measured as feet above MHHW/inundation
The highest measured water levels during Hermine were recorded at the following four locations:
- Cedar Key, Florida: 6.1 feet.
- Hatteras, North Carolina: 4.4 feet.
- Sewells Point, Virginia: 3.4 feet.
- Apalachicola and Clearwater Beach, Florida: 3 feet.
Legend (color code for this graphic)
The graphic shows the path of Hermine with colored circles representing measured highest water levels at points along the Eastern seaboard and the Gulf Coast of Florida.
- Green circles: Green-colored circles represent locations where highest water levels were between 0 and one feet.
- Yellow circles: Yellow-colored circles represent locations where highest water levels were between one and three feet.
- Orange circles: Orange-colored circles represent locations where highest water levels were between three and five feet.
- Red circles: Red-colored circles represent locations where highest water levels were between five and eight feet.
- Purple circles: Purple-colored circles represent locations where highest water levels were greater than eight feet.
Did you know?
The Center for Operational Oceanographic Products and Services (CO-OPS) and its predecessors have gathered oceanographic data along our nation's coasts for over 200 years to protect life, property, and the environment. Serving both the public and other government agencies, CO-OPS is the authoritative source for accurate, reliable, and timely water-level and current measurements that support safe and efficient maritime commerce, sound coastal management, and recreation.
