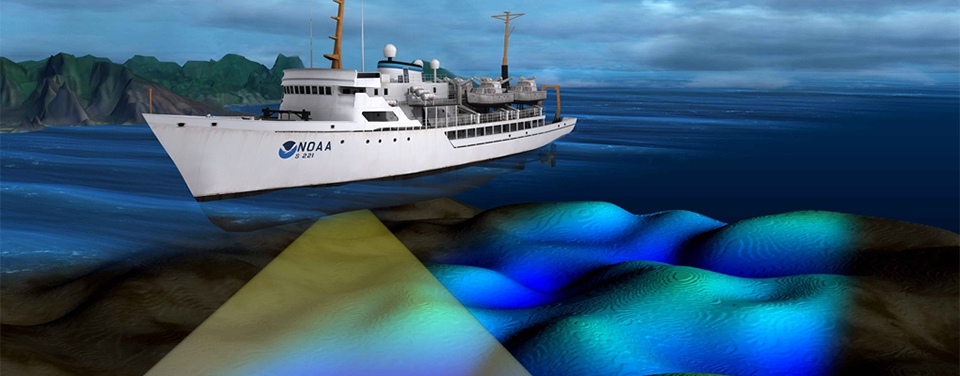
A NOAA survey ship uses its multibeam echo sounder to conduct hydrographic surveys. Multibeam sonar measures the depth of the sea floor by analyzing the time it takes for sound waves to travel from a boat to the sea floor and back.
Many of the things you buy in the store probably traveled, at some point, on a ship. The U.S. marine transportation system moves nearly 80 percent of the United States' overseas trade (by weight). Over 1.34 billion metric tons of cargo, valued at $1.73 trillion, shipped in and out of U.S. ports in foreign trade in 2011. Keeping our marine transportation system functioning in a way that is safe, efficient, and environmentally sound requires information about water depth, the shape of the sea floor and coastline, the location of possible obstructions, and other physical features of water bodies. Hydrography is the science behind this information, and surveying is a primary method of obtaining hydrographic data.
A little history
In 1807, President Thomas Jefferson signed a mandate ordering a survey of our young nation’s coast. And so began the history of the Survey of the Coast, an organization that would go through changes to its name and structure, but not its fundamental mission: providing nautical charts to the maritime community for safe passage into American ports and along 95,000 miles of U.S. coastline. Today, as it did in Jefferson's day, the Office of Coast Survey conducts the hydrographic surveys that are the fundamental component of nautical charts. Depending on the charting requirement, NOAA uses two kinds of sonar to survey the sea floor: multibeam and side scan
Using sonar to survey
Multibeam sonar measures the depth of the sea floor by analyzing the time it takes for sound waves to travel from a boat to the sea floor and back. It provides amazing detail of the sea floor, especially in rocky and rough terrain, where it gives a complete picture of the bottom. Multibeam sonar is very useful in areas such as the Northeast U.S. and Alaska, where the sea floor is complex and often strewn with thousands of rocks. However, in relatively shallow, flat areas, like those found along the mid-Atlantic coast, the multibeam may not be very efficient. So, NOAA surveyors use another tool called side scan sonar. This kind of sonar creates an image of the sea floor, but does not determine depths. If surveyors find a wreck or obstruction using side scan sonar, they will determine the least depth with multibeam sonar.
Determining positions
The other essential ingredients to charting are accurate positioning and tides or water levels. Until the 1970s, hydrographers determined positions of water depths by using a sextant. Today’s modern Global Positioning System provides accuracy and efficiencies never dreamed of only a few years ago. Information gained by measuring and predicting the rise and fall of tides, and accurate positioning, is critical to mariners as they guide large ships in and out of our ports. In many cases, ships are less than three feet off the bottom and within inches of clearance below a highway bridge. Today's technology gives pilots and mariners the knowledge to maneuver along America's coastline and into our ports and harbors.
Data processing
Once hydrographic data has been collected using sonar, it is put into context, or referenced to the location at which it was collected. The raw soundings are adjusted to a standard or absolute water level (datum) using predictions (and subsequent final observed tides) from tidal observations collected at water-level stations. Horizontal positions (latitude and longitude) are recorded using Differential Global Positioning System equipment and need no further adjustment. Information about the coastline is compared extensively to recent coastal survey maps to identify new features and modifications. Eventually, the sounding data are re-processed to produce the final soundings.
Nautical charts
As the nation's nautical chartmaker, the Office of Coast Survey uses hydrographic data to update NOAA's suite of over a thousand nautical charts. A nautical chart is a map for navigating a waterway and is one of the most fundamental tools available to the mariner. The numbers on a nautical chart are depth measurements, acquired from hydrographic surveys. Charts also include other information critical to safe navigation. The measurements and symbols tell ship captains or recreational boaters if an area is too shallow or has dangers to navigation. They also depict aids to navigation and shoreline features.
Survey parties
Since the early 1800s, Coast Survey has sent field parties to survey the nation's coastal waters, collecting the information needed to create nautical charts. : With U.S. waters covering over three million square nautical miles, Coast Survey must set priorities. Hydrographers evaluate the 500,000 square nautical miles that are navigationally significant, and then, each spring, field parties set out to survey priority sections of the 43,000 square nautical miles deemed to be critical. The parties, assigned to NOAA survey ships or smaller navigation response teams, remain available to deploy to areas hit by hurricanes or other disasters, to conduct rapid surveys designed to locate dangers to navigation. Their rapid maritime response helps speed re-opening of ports and resumption of shipping.
Disaster response
Following hurricanes or other types of coastal disasters, navigation response teams, part of the Office of Coast Survey, conduct hydrographic surveys of the ocean floor, looking for changes in depth or debris from storms below the surface of the water that could pose great danger to vessel traffic above. Six navigation teams are strategically located around the country, ready to collect data needed to inform officials of navigational hazards and to help the U.S. Coast Guard find alternative routes for commercial and military ships.
Other applications
In addition to generating the data needed to update nautical charts, hydrographic surveys support a variety of activities such as port and harbor maintenance (dredging), coastal engineering (beach erosion and replenishment studies), coastal zone management, and offshore resource development. Detailed depth information and seafloor characterization is also useful in determining fisheries habitat and understanding marine geologic processes.
Sonar, short for Sound Navigation and Ranging, is helpful for exploring and mapping the ocean because sound waves travel farther in the water than do radar and light waves. NOAA scientists primarily use sonar to develop nautical charts, locate underwater hazards to navigation, search for and map objects on the sea floor such as shipwrecks, and map the sea floor itself.
 An official website of the United States government.
Here's how you know we're official.
An official website of the United States government.
Here's how you know we're official.