Professional Development
Important! We are currently revising our professional development modules and have temporarily removed this entire section from our website.
While the modules listed below are no longer available, we have left the remainder of this page intact for reference so that you may view the professional development topics. Thank you for your patience.
Teachers need accurate information and resources to integrate ocean, coastal, and climate science into local and state curricula. These resources provide a variety of lesson plans, background information, resource links, tutorials, archived professional development seminars, media galleries, and interactive tools that can be used in a variety of ways in grades 5-12. Many of the resources provided here were created in partnership with the National Science Teachers Association. Teachers can access resources in additional topics at the NSTA Learning Center site, https://learningcenter.nsta.org/.
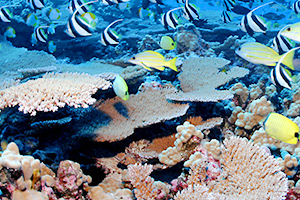
Professional Development
Corals
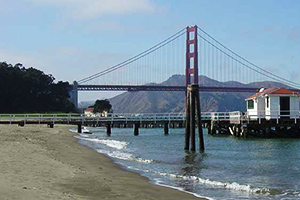
Professional Development
Tides and Currents
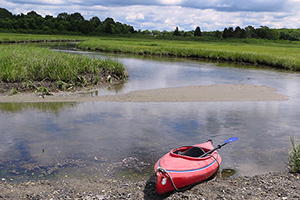
Professional Development
Estuaries
Professional Development
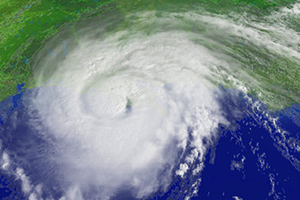
Climate
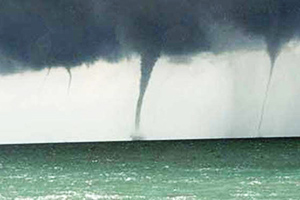
Professional Development
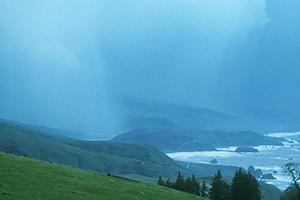
Oceans, Weather, and Climate