NOAA provides scientific expertise, data, tools, training, and assistance to help people respond to oil and chemical spills.
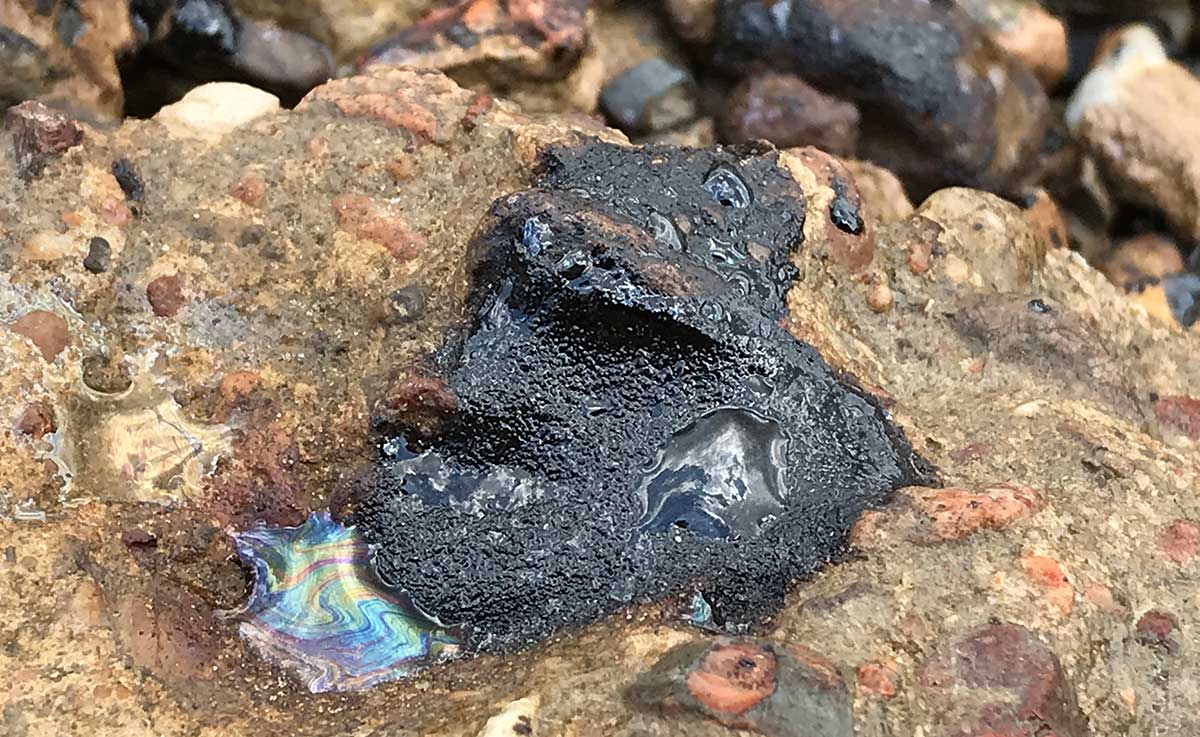
An oiled rock along the Mississippi River shoreline near New Orleans following a fuel oil spill in April 2018.
NOAA brings scientific expertise to the table
Each year, there are thousands of oil and chemical spills in coastal waters around the nation. These spills range from small ship collisions to fuel transfer mishaps to massive spill events like the BP Deepwater Horizon oil spill.
The release of oil and chemicals into our coastal waterways can kill wildlife, destroy habitat, and contaminate critical resources in the food chain. Spills can also wreak havoc on the economies of coastal communities by forcing the closure of fisheries, driving away tourists, or temporarily shutting down navigation routes. And these environmental and economic damages can linger for decades.
When dealing with oil and chemical spills, there are many questions that need to be answered. What was spilled? Where is the spill likely to travel in the water? How is the local environment affected now — and how might it be affected down the road? What's the best way to clean up the spill? How will balance be restored to the environment after the damage has been done? NOAA brings scientific expertise to the table to help answer these questions.
Related links:
Response and Restoration
NOAA is charged with responding to oil spills, hazardous material releases, and marine debris, primarily through the Ocean Service’s Office of Response and Restoration (OR&R). This office’s Emergency Response Division is often first on the scene, providing scientific expertise to predict where the spill is going and what impacts it might have, identifying resources at risk, and recommending clean-up methods.
Regional NOAA scientific support coordinators organize NOAA resources in support of federal and state response efforts and work with scientists from other public agencies, academia, and the private sector to support operations when an oil or chemical spill occurs.
One of the primary services provided by the Office of Response and Restoration is advanced computer modeling, necessary to forecast where a given spill might go and its potential effects on the coastal environment. To help in planning and responding to spills, NOS scientists also create environmental sensitivity index maps. These maps are created to serve as quick reference guides that describe the characteristics and uses of the shorelines near spill areas — critical information that helps responders decide how to deploy limited resources and manpower.
First responders also have access to numerous other tools and information provided by NOS scientists. These tools include job aids for use during oil spills to determine amounts of oil spilled and best response guidelines. Specialized aids are also available for sensitive habitats such as coral reefs.
The work isn’t done when the bulk of the spill clean-up is complete. Staff from the Office of Response and Restoration’s Assessment and Restoration Division play a critical role in NOAA’s Damage Assessment, Remediation, and Restoration Program — a cross-NOAA program comprised of scientists, economists, attorneys, and restoration experts. These experts work in teams to protect and restore coastal resources threatened by waste sites, oil and chemical spills, and ship groundings.
Through a process known as natural resource damage assessment, NOS scientists determine the nature and extent of injuries to natural resources from spills, and the restoration actions needed to reverse these losses. NOS experts also use scientific and economic studies to determine the level of restoration necessary to restore the natural resources and services they provide.
Related links:
Tracking Contamination
When a disaster like a major oil spill occurs, one of NOAA’s important jobs is to measure and assess the impact on coastal and marine ecosystems so that measures can be taken to attempt to restore them to pre-spill conditions, and to provide information for natural resource damage assessment.
NOAA's National Centers for Coastal Ocean Science play a central role in this process by tracking contamination and its effects on the animals and plants that live in the areas impacted by a spill.
Scientists tracks contamination in several ways. First, they collect and maintain long-term monitoring data on contaminants measured in sediments, shellfish, and water for all U.S. coasts and the Great Lakes. Shellfish are particularly good indicators of water quality because they concentrate pollutants from the water in their tissues as they feed.
When a spill occurs, NCCOS scientists attempt to collect sediments and shellfish before the spill hits the shore. If oil reaches the shore, scientists will collect sediments and shellfish for a second time. The difference between these two measurements indicates how much contamination can be attributed to the spill. Scientists also collect water samples to “fingerprint” the oil or chemicals from a spill, allowing them to distinguish that oil from contamination coming from other sources.
NCCOS scientists also try to pinpoint which areas may have been most affected by a given spill. They do this by looking at the creatures that live in the sediment and analyzing whether or not the sediment has become toxic to these organisms. This kind of “bioeffects” research helps scientists understand how contamination is affecting the food chain.
Related links:
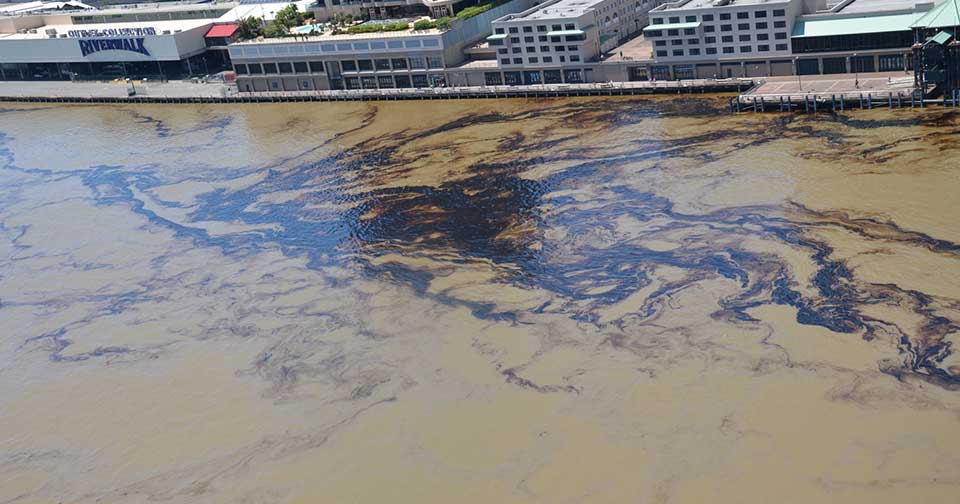
Oil along the New Orleans River Walk following a spill on Thursday, April 12, 2018. Credit: U.S. Coast Guard
View from above
For major spills, often the best perspective is from high above. NOAA’s National Geodetic Survey (NGS) deploys to the scene of major spills to collect aerial images to capture a bird’s eye view of spill and coastal areas.
NGS uses NOAA aircraft outfitted with mapping sensors. Data acquisition typically focuses on the land-water interface in high-priority areas in an effort to protect wildlife and the shoreline.
NGS also provides remotely sensed imagery from previous mapping projects to help response personnel assess shoreline features that were present prior to the spill.
NGS has been collecting aerial photographs of our nation’s coast since the early 1900s. Following an incident such as an oil spill or a natural disaster such as a hurricane, NGS photos provide emergency and coastal managers with information needed to develop recovery strategies, identify hazards, and locate errant vessels. The images also provide documentation necessary for damage assessment through the comparison of before and after imagery.
These photos are not just used to support disaster response. NGS aerial photos are also used to define the national shoreline, create maps and charts, and monitor environmental change. More than 500,000 photo negatives, dating from 1945 to the present year, exist in NOS archives and are maintained by the National Geodetic Survey.
Related links:
Ocean observing
The U.S. Integrated Ocean Observing System (IOOS®) is a coordinated network of people and technology that compiles and distributes data on our coastal waters, Great Lakes, and oceans. It includes partners at all levels of government, academic institutions, and the private sector.
Following a major spill, responders need information such as water levels, current speed and direction, wind speed and direction, and wave heights. This information is collected by a variety of organizations (including NOS) using satellites, buoys, tide gauges, radar stations, and underwater vehicles. IOOS helps bring this information together, so that it can be coordinated and made available to those who need it.
As an example, IOOS regional partners from the Gulf Coast, Southeast, Mid-Atlantic, Northeast, Southern California, and the Northwest are working in concert to provide data, tools, models, and other products to support BP Deepwater Horizon oil spill response efforts.
Part of this support involves the use of underwater unmanned gliders to assist in the tracking of oil flows at various levels in the water column.
Glider technology is unique in that it collects critical data throughout the water column at relatively low cost and at no risk to human life. This is the first oil spill response in the U.S. where this technology has been applied.
IOOS is also using high frequency radar technology to measure Gulf of Mexico surface current speed and direction in near real time. Data collected are incorporated into oil spill trajectory models.
Related links:
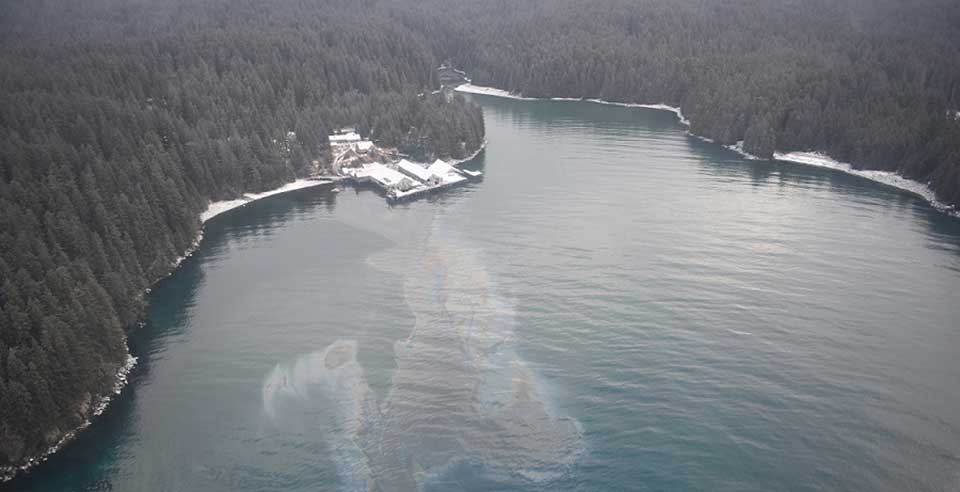
On Feb. 26, 2018, oil was released into the Shuyak Strait in Alaska after an abandoned building collapsed. Credit: U.S. Coast Guard
Delivering data
Determining where oil or chemicals will move following a spill requires knowing how the water and wind are moving. The Center for Operational Oceanographic Products and Services (CO-OPS) operates and maintains an extensive network of hundreds of coastal measurement systems around the nation that collect and provide this verified information.
The collected data are important to helping mariners safely navigate in and out of ports and harbors, so CO-OPS operates these systems year round, not just following an oil spill. However, in support of major oil spill response efforts, CO-OPS may modify existing products to better meet the needs of responders and communities.
For example, CO-OPS delivers a product called Storm QuickLook to provide a synopsis of near real-time ocean and weather observations at locations when a hurricane is threatening an area. In response to the Deepwater Horizon oil spill, CO-OPS reengineered NOAA Storm QuickLook to include not only water level and weather data in potentially affected areas, but also a NOAA graphic showing the location of the oil spill.
CO-OPS also developed a specialized display of Physical Oceanographic Real-Time System (PORTS®) data from the Gulfport, Pascagoula, and Mobile Bay PORTS. Using MyPORTS, a customizable PORTS® application, CO-OPS created a display of current speeds and directions, as well as weather observations in the region of the Deepwater Horizon oil spill.
Operated year round in 21 locations around the U.S., PORTS® measures and disseminates observations and predictions of water levels, currents, salinity, and weather information such as winds, atmospheric pressure, and air and water temperatures needed to support the safety and efficiency of maritime commerce and coastal resource management.
Related links:
Charting the way
The oceans are trading routes for the planet. The U.S. exports over $11 billion worth of wheat, grown from Maryland to Washington, to 67 countries, with shipments from the East Coast, West Coast, Gulf Coast, and the Great Lakes. And that is just one example. All segments of our economy rely on timely exports and imports. The safe movement of goods in and out of ports can't stop because of an oil spill.
To help mariners safely navigate following major spills, the Office of Coast Survey updates nautical chart products that display spill zone forecasts based on the best-available projections. The charts depict the 48-hour forecast for oil location, juxtaposed against the standard safety fairways that lead to port approaches.
These electronic and raster charts alert ship captains to the location of the forecasted spill area, so that captains can take efforts to avoid the spill. The U.S. Coast Guard also uses the chart information to develop instructions and alternative anchorages for vessels transiting U.S. waters.
A nautical chart depicts the nature and shape of the coast, water depths, and general topography of the ocean floor; locations of navigational danger and protected marine life; predicted tides; locations of human-made aids to navigation; and, in port areas, traffic separation schemes.
Ships transiting U.S. waters are required to carry nautical charts, which they use to plan their routes for intended voyages. For over 200 years, NOAA's Office of Coast Survey has created and updated the nation's charts, providing mariners with the accuracy and precision they need to navigate the shortest, safest, and most economical routes.
Related links:
Helping people
NOAA's Office for Coastal Management (OCM) helps communities prepare for and adapt to the impacts of major spills.
NOAA experts in OCM not only provide data, but also the tools, training, and assistance needed to turn these data into useful information. Satellite imagery and socioeconomic findings represent the most requested data sets, and services provided include skilled facilitators who help affected parties come together to determine how to best address current and future oil-related impacts. OCM also helps states prepare for the potential impacts of significant oil and chemical spills.
OCM administers the National Coastal Zone Management Program, a voluntary federal-state partnership that protects, restores, and responsibly develops our nation's diverse coastal communities and resources. Through this program, experts provide technical and financial assistance and deliver federal updates, information, and contacts to to state coastal management programs. OCM staff also help coastal managers prepare for the possibility of oil reaching their coastal waters and shores.
In addition, OCM administers the National Estuarine Research Reserve System, a network of estuarine areas established across the nation for long-term stewardship, research, and education. Estuaries are crucial spawning areas for many commercial and recreational fish and shellfish, and they buffer upland areas from flooding and shoreline erosion.
Since the effects of oil in estuaries can be especially damaging, OCM maintains close contact with the regional reserves affected by spills to help them prepare for the possible landfall of oil or chemicals. Their assistance includes serving as a clearinghouse to match existing expertise with specific needs at the affected reserves. In addition, the reserve system provides a wealth of long-term environmental data that is used to support planning and modeling related to spills.
The release of oil and chemicals into our coastal waterways is a major problem — for our environment in particular, but also for the people and communities that depend on the environment for survival, commerce, recreation, and culture. Marine pollution can affect the availability of food, particularly in the fishing industry. An oil or chemical spill also has the potential to shut down beaches or other recreational areas. Closures such as this can put a damper on your vacation if you're a tourist or simply someone who enjoys taking advantage of natural recreational resources. On an even larger scale, if you live in an area that depends on tourism for commerce, your entire local economy could be put at risk.
 An official website of the United States government.
Social