HomeExplore AERIAL PHOTOGRAPHY AND SHORELINE MAPPING
Aerial Photography and Shoreline Mapping
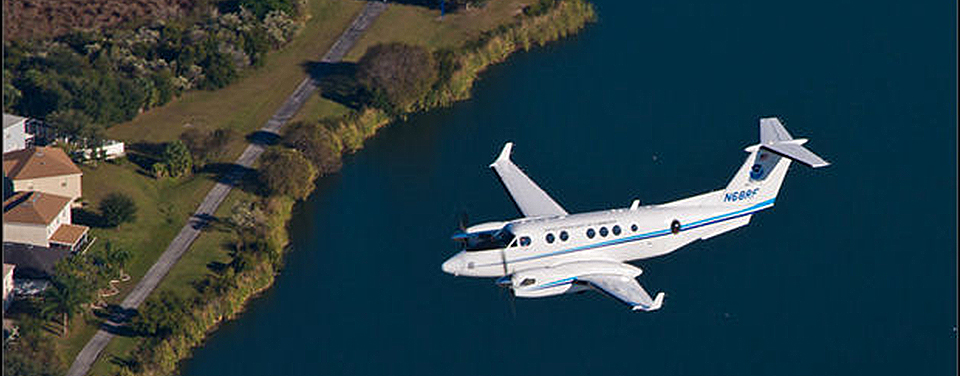
NOAA’s aircraft, the Hawker Beechcraft King Air 350CER, is equipped with two downward-facing sensor ports that can support a wide variety of remote sensing systems, including digital cameras, multispectral and hyperspectral sensors, and topographic and bathymetric LIDAR systems.
What better way to monitor the approximately 95,000 miles of U.S. coastline than from a bird’s eye view? Since the early 1900s, the National Geodetic Survey has been doing that—taking photographs from airplanes to capture the Earth below. Today, the capture of these aerial photographs is controlled by Global Positioning System techniques and the photos are used to define the national shoreline, create maps and charts, monitor environmental change, and provide damage assessment in response to manmade or natural disasters.
Aerial photos: the basics
Aerial photographs are a little different than the photos you might take with your own camera. The primary aerial photographic product is a high-resolution (39 megapixel) digital color photograph. Depending on the camera lens, photos can be taken in black-and-white or near-infrared. Traditionally, photos are captured while flying at 10,000 feet over the ground. Each photo covers an area of approximately two square miles of the Earth's surface. Each photo is spatially referenced by the Global Positioning System so that accurate latitude and longitude information can be determined for any location in the photo. In recent years, The National Geodetic Survey has begun generating aerial images from Light Detection and Ranging (LIDAR) technology. LIDAR images are similar to digital photographs in that they are high resolution images that provide positional information. However, unlike digital photographs, LIDAR images also provide an extremely accurate means for measuring the height of objects on the ground.
Digital imagery has been primarily used since 2008. Prior to 2008, photos were collected with traditional film cameras. More than 500,000 film negatives and digital images, dating from 1945 to the present year, exist in NOS archives and are maintained by the National Geodetic Survey. Surveys are conducted on varying time cycles, depending on the amount of change caused by human or natural forces. Photography is acquired when weather conditions, the sun angle, and water levels are optimal to capture the right shot.
A basis for nautical charts
Shoreline and coastal features depicted in aerial photographs and Light Detection and Ranging (LIDAR) images are the largest sources of material used to create coastal survey maps. These data sets, in turn, provide information for updating NOAA nautical charts. Combining information from aerial photographs and LIDAR images with hydrographic data obtained by survey ships helps ensure nautical charts accuracy. Nautical charts, which mariners are required to use to plan their routes for intended voyages, are regularly updated as photographs document America's changing shorelines.
Boundary definitions
Ever wonder who marks where one property line stops and another starts? What about when that boundary is in the water? The shoreline—where water and land meet—is commonly referenced as a boundary component in legal descriptions, as the point of origin for jurisdictional boundaries, and as the boundary between public and private ownership. One of the tools used to define the boundaries between private, state, and federal ownership and jurisdictions, including the territorial sea and the Exclusive Economic Zone, is aerial photography.
Coastal change assessment
Changes in the shape of the shoreline can be analyzed by measuring differences in past and present shoreline locations. Comparison of ‘before’ and ‘after’ aerial photographs is one way that scientists determine shoreline change. By looking at data over a period of time, scientists can even determine how fast the coast is changing, which can help with planning for the future.
Disaster response
Just hours after a hurricane hits a coastal area, the National Geodetic Survey begins flying photo survey missions to assess storm damage. The digital photos often are made available over the internet within 12 hours after the survey mission. The data contained in these photos provide emergency and coastal managers with information needed to develop recovery strategies, facilitate search and rescue efforts, identify hazards to navigation and HAZMAT spills, locate errant vessels, and provide documentation necessary for damage assessment through the comparison of before and after imagery.
Benthic mapping
Scientists use the term 'benthic' to refer to anything associated with or occurring on the bottom of a body of water. Understanding benthic habitats is necessary for development and implementation of a wide variety of resource management policies. Benthic habitats are mapped and studied using a variety of tools and techniques. Aerial photography and Light Detection and Ranging (LIDAR) are two such tools. Scientists use aerial photographs and LIDAR imagery to identify different habitats along the shore and in shallow water.
Elevation mapping
Knowing the elevation of a coastal area is important for conservation, development, planning, and safety. Both the NOAA National Geodetic Survey and the NOAA Coastal Services Center collect high-resolution elevation data using Light Detection and Ranging (LIDAR) and Interferometric Synthetic Aperture Radar (IfSAR or InSAR) technologies. Coastal elevation maps provide important information for coastal communities, as in coastal areas a change in elevation of one foot can make huge differences in habitats and human safety.
 An official website of the United States government.
Here's how you know we're official.
An official website of the United States government.
Here's how you know we're official.