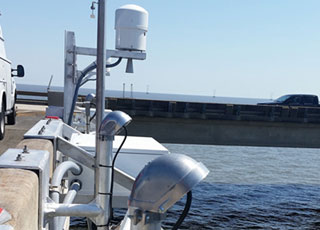
The Center for Operational Oceanographic Products and Services (CO-OPS) and the National Weather Service, partnered to fill a much needed gap in observations of Lake Pontchartrain that will help New Orleans to be more resilient in the face of severe storms. CO-OPS installed a water level station that uses new microwave water level measurement technology and includes a meteorological station and that will help local, state, and federal emergency managers plan for and respond to flooding. This station will provide continuous real time measurements before, during, and after a storm event. The station is built to withstand a 110 mile-per-hour winds and will provide real time data for accurate lake modeling, storm surge predictions, and emergency planning and evacuation orders.
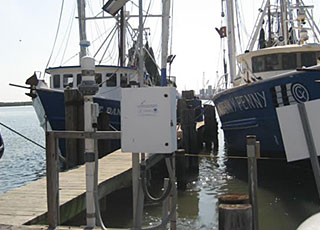
Two southeast Louisiana shipping hubs, critical to the U.S. economy, became part of NOAA's Physical Oceanographic Real-Time System (PORTS®). The new multi-sensor systems can increase navigation safety and allow for increased efficiency on ships transiting through the Port of Morgan City and Port Fourchon, Louisiana. PORTS® is an integrated system of oceanographic and meteorological sensors that provide mariners with accurate and reliable real-time information about environmental conditions in seaports. Morgan City is a newly established foreign trade destination, while Port Fourchon is one of the nation's busiest energy ports, servicing 90 percent of the deepwater Gulf of Mexico oil and gas industry. Each day Port Fourchon handles more than 20 percent of the nation's energy supply. Economic benefit studies from four PORTS® locations around the U.S. have shown a 50 percent reduction in groundings and over $50 million in economic efficiency benefits every year.
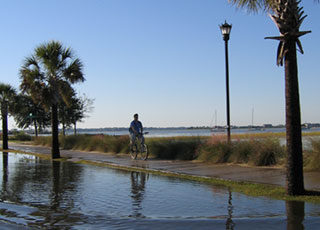
Coastal communities can start preparing now for increased flooding caused by sea level rise and storms with new coastal intelligence provided this year through the Center for Operational Oceanographic Products and Services (CO-OPS). CO-OPS issued an update to its 2014 report, Sea Level Rise and Nuisance Flood Frequency Changes around the United Statesthat examines the current state of climate-driven "nuisance flooding" and provides an outlook for 2015. This information helps coastal communities become more resilient by allowing them to assess flooding risk and develop ways to mitigate and adapt to the effects of sea level rise. CO-OPS, in partnership with National Geodetic Survey, U.S. Integrated Ocean Observing System Program, Office of Coast Survey, and Office for Coastal Management also expanded an inundation benchmark project to Norfolk, VA and Beaufort, NC that will allow weather forecasters and emergency management officials to use well-known landmarks, such as statues, as a way to better visualize and communicate water levels and impacts during floods. CO-OPS maintains the nation's only water level observation system and is the authoritative source for sea level data. As of this year, more than 140 of the existing 210 water level gauges have operated for more than 30 years, providing consistent high quality records of sea level change for the nation through sea level trends and statistics put out through CO-OPS Sea Level Trendswebsite.
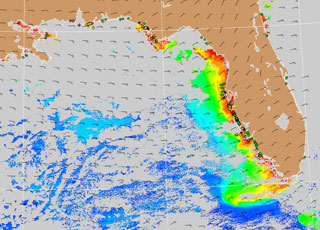
Red Tide Forecasts for Florida and Texas will now be even more accurate thanks to an improved method of forecasting that will allow NOAA scientists to see more clearly where the harmful algal blooms (HAB) that cause this phenomenon are located. This helps local residents and visitors make informed decisions about their recreational choices during a HAB event and aids public health managers who coordinate response efforts and mitigate the effects of Red Tide. In Florida and Texas, Red Tide is primarily caused by the harmful algae species, Karenia brevis and can cause severe respiratory irritation in people, produce large fish kills and discolored water along the coast. NOAA uses a combination of satellite imagery and water samples collected by local partners to forecast the location and intensity of Red Tide events. NOAA's HAB forecasts can give public health officials a much better idea of the areas impacted by a bloom. This product is part of NOAA's Harmful Algal Bloom Operational Forecast System, which includes partnerships across NOAA's line offices.
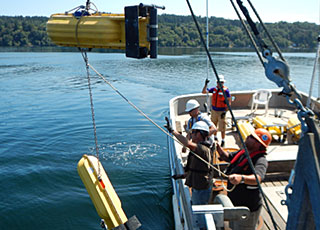
The Center for Operational Oceanographic Products and Services (CO-OPS) updated the tidal current predictions for Casco Bay, Maine this year. These updates ensure commercial and recreational mariners have the most recent tidal and current information for safe marine navigation. CO-OPS also began the process of updating current predictions for Puget Sound this year by beginning a multi-year survey. In order to provide the most accurate predictions possible, CO-OPS must periodically resurvey various coastal and estuarine locations. For example, the NOAA tidal current predictions for the Puget Sound region are presently being generated from limited amounts of data collected in the 1930s-1960s. With the improvements in measurement and computing technology we have today, the accuracy of these modern predictions are significantly improved once they are updated. NOAA has been providing tidal and current prediction information to mariners since 1865 and still provides this service to the nation today through a variety of media that are broadly redistributed through publications, newspapers, television, radio, and local media.
 An official website of the United States government.
Here's how you know we're official.


