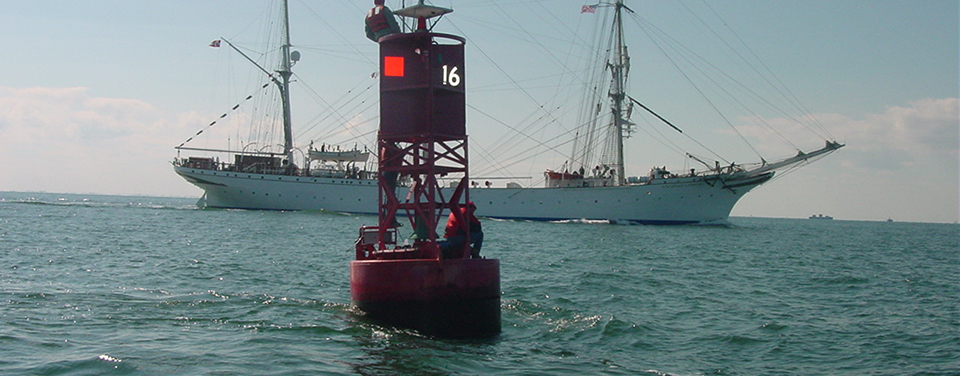
The two main components of currents are speed and direction. To measure currents, buoys are equipped with Global Positioning System technology or satellite communications that relay data and information.
What are tides and currents?
Tides. If you live near the coast or have ever visited the beach, you are probably aware of tides. But did you know that tides are really big waves that move through the ocean in response to the forces exerted by the Moon and the Sun? Tides start in the ocean and move towards the coast, where they appear as the regular rise and fall of the sea surface. How much the water level changes over the day varies depending on where you are and what day it is.
Currents. Currents put motion in the ocean! Tides involve water moving up and down; currents involve the movement of water back and forth. Currents are driven by several factors. Tides are one of these. Wind, the shape of the land, and even water temperature are other facts that drive currents.
We need accurate tide and current data to aid in navigation, but these measurements also play an important role in keeping people and the environment safe. A change in water level (due to tides) can leave someone stranded (or flooded). And knowing how fast water is moving—and in what direction—is important for anyone involved in water-related activities. Predicting and measuring tides and currents is important for things like getting cargo ships safely into and out of ports, determining the extent of an oil spill, building bridges and piers, determining the best fishing spots, emergency preparedness, tsunami tracking, marsh restoration, and much more.
NOS has been measuring and predicting tides since the early 1800s. We've come a long way since the days of sticking a rod into the water to determine water level. Today, we use engineered air acoustic and pressure systems to automatically detect and record changes in water levels. All data are recorded electronically, transmitted via satellite every six minutes, and made available online. At the backbone of this system is a network of long-term, continuously operating water-level stations known as the National Water Level Observation Network
The two main components of currents are speed and direction. To measure a current, toss an object into the water and time how long it takes to get to a certain point a known distance away. Granted, technology allows us to be a little more accurate and sophisticated in our measurements. For example, the object in the water might be a buoy that is equipped with Global Positioning System technology or satellite communications that relay data and information.
Want to know the high and low tides for locations around the United States? Visit the Center for Operational Oceanographic Products and Services Web site. You'll find tidal predictions for more than 3,000 water-level stations around the United States. Some of the stations (called "reference stations") include full daily predictions while others (called "subordinate stations") require you to do a little math to apply differences between the times and heights of tides at subordinate stations and at specified reference stations.
If the level of water is constantly changing, how do we know how much water levels have risen or fallen from "normal?" To define "normal," scientists use a reference, or datum, as a starting point from which all measurements are made. The numbers that appear on a nautical chart represent water depths measured relative to such a datum. Mean lower low water, or the average of all observed lower low waters (the lower of the two low waters of any tidal day), is known as chart datum in most areas. Mean high water, or the average of all observed high-water levels, is the datum used to represent shoreline on charts. Tidal datums also provide baseline determinations for the Exclusive Economic Zone, as well as boundaries between private, state, and federal ownership and jurisdiction.
When a ship passes under a bridge, it is best if the ship doesn't hit the bridge…right? Might sound like a no brainer, but ships are getting bigger, and the space underneath bridges is staying the same, making for a potentially tight squeeze. Knowing how much space is available under a bridge requires knowing what level the water is at any given time. NOAA uses microwave "air gap" sensors that mount on bridges over navigation channels. The sensor sends microwave signals downward to measure the position of the water's surface. This information provides ship captains with a direct measurement of the clearance under bridges, helping them determine if it is safe to pass. Cool, huh?
What's going on in a busy port is much like what's going on at a busy airport. Just as aircraft flying in and around an airport need current weather and ground conditions, ships coming into port need to know exactly what's going on in the water and in the air in real time. Enter the Physical Oceanographic Real-Time System, or PORTS®. PORTS provides mariners with real-time information such as water levels, current speed and direction, winds, air temperature, and water temperature and salinity. This stream of data is freely available online and ship captains can also access the data via the phone.
Climate change has certainly generated a lot of buzz. A shift in climate doesn't just mean changes to air temperatures or weather patterns…it could also impact the ocean. A warmer climate could mean higher sea levels, from both melting sea ice and expansion of seawater. The Center for Operational Oceanographic Products and Services maintains a record of long term water levels, which can be used to determine the rate that local sea levels are changing. With more than half of us living in coastal states, that's news many of us will want to know.
When someone is lost at sea, time is of the essence. Knowing the speed and direction of currents can help the U.S. Coast Guard conduct search and rescue operations with greater accuracy. The Integrated Ocean Observing System uses high frequency radar systems to develop maps of surface currents for the Coast Guard to use in their operations. These maps may also be used to support other scientific work, such as oil spill response, harmful algal bloom monitoring, and water quality assessments.
 An official website of the United States government.
Here's how you know we're official.
An official website of the United States government.
Here's how you know we're official.